

Introduction
This is a simple application for beginners that shows how to create interactive charts using HTML 5 and CSS tools. We know that HTML 5 is the advanced version of HTML. Basically HTML 5 can be used to develop 3D applications. This article is intended to help with the use of HTML5 tools to develop interactive chat applications. CSS is the acronym for Cascading Style Sheet that is used for design. CSS defines how HTML elements are to be displayed. Canvas is an important tag of an HTML 5 that is used to show the image and text in an HTML 5 application. I hope this article helps to create interactive chart applications using HTML 5 and CSS tools.
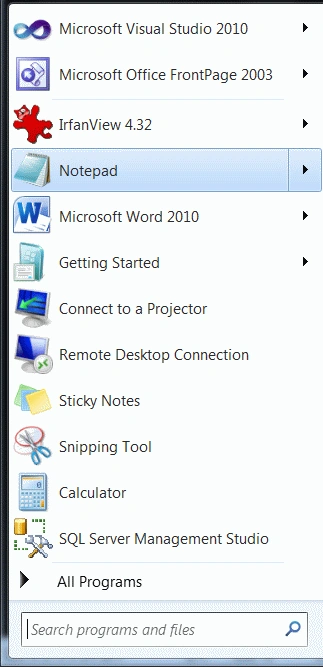
Step 1: First open an HTML editor such as Notepad.
- Open start->Notepad.
- The name of the editor is "chart".
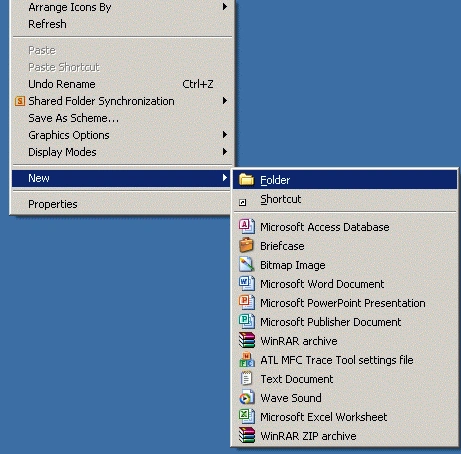
- Right-click on desktop->new->Folder.
- The name of the folder is "demo".
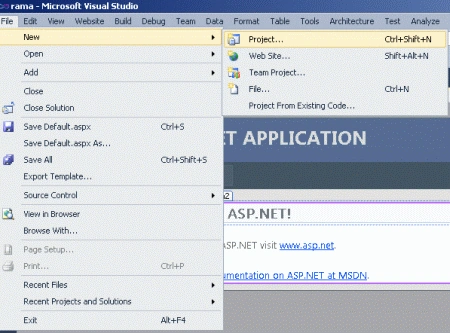
- Go to file -> New->Projects.
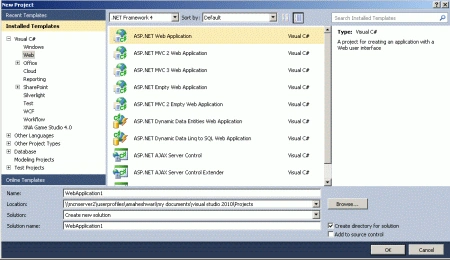
- Create an ASP. NET Web Application.
- Name of "interactive.aspx".
- Right-click on Solution Explorer.
- Add->add new item->HTML form.
- The Name of the HTML form is "slide.html".
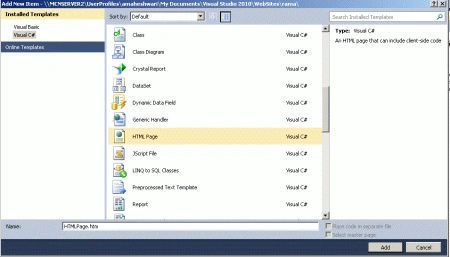
Code
- body
- {
- background: #fff;
- color:Green;
- font: 100.1% Verdana;
- }
- #holder
- {
- height:500px;
- left: 70%;
- margin: 0 0 0 -420px;
- position:relative;
- top: 1;
- width: 540px;
- }
- #copy
- {
- bottom: 0;
- font-size: .9em;
- position:relative;
- right: 3em;
- text-align:right;
- }
Step 6 : Add a JavaScript file to the application. The P1.js file provides the functionality of moving interactive chart. Set a R1.css that sets color, size and font properties of an interactive chart body.
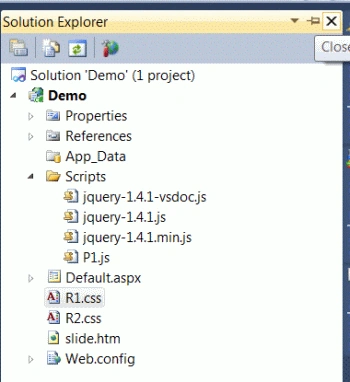
- <link rel="stylesheet" href="R1.css" media="screen"/>
- <script type="text/javascript" src="Scripts/P1.js"></script>
Step 7: Now in this step we define a draw path function. In the function we define a path alignment of an interactive chart application.
Code
- function drawPath()
- {
- var p = [];
- for (var j = 1, jj = X.length; j < jj; j++)
- {
- p.push(X[j], Y[j]);
- }
- p = ["M", X[0], Y[0], "R"].concat(p);
- var subaddon = "L" + (ptx - 10) + "," + (ctx - 10) + ",50," + (ctx - 10) + "z";
- path.attr({ path: p });
- sub.attr({ path: p + subaddon });
- }
Step 8: In this step, we define a function to set a color, blankets, and buttons of an interactive chart application.
Code
- var p = [["M"].concat(translate(0, values[0]))],
- color = "hsb(100°, 2, 2)",
- X = [],
- Y = [],
- blankets = r.set(),
- buttons = r.set(),
- w = (ptx - 60) / values.length,
- isDrag = -1,
- start = null,
- sub = r.path().attr({ stroke: "none", fill: [90, color, color].join("-"), opacity: 0 }),
- path = r.path().attr({ stroke: color, "stroke-width": 2 })
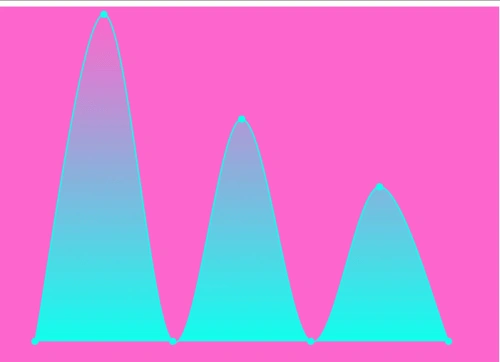
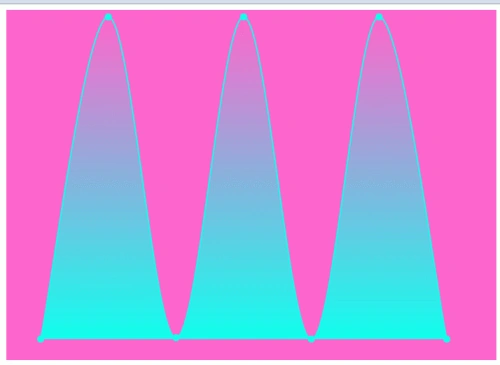
Step 9: Press Ctrl+ F5 to run the code; the output is shown below.
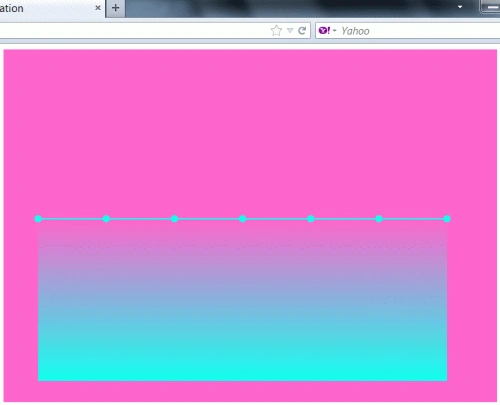
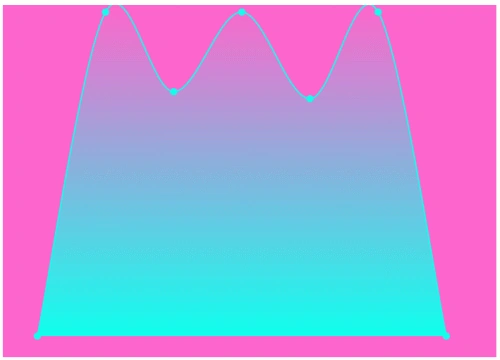
Resources
Here are some useful resources
Aaron CronjePosted Feb 12, 2012, 10:46 PM
Good Work..