

Introduction
This is a simple application for beginners that shows how to create a Pie Chart using HTML 5 and CSS tools. We know that HTML 5 is the advanced version of HTML. Basically HTML 5 can be used to develop 3D applications. This article is intended to help with the use of HTML5 tools to develop a simple pie chart application. We know that HTML is HyperText Markup Language and is used to display data in a browser. CSS is the acronym for Cascading Style Sheet that is used for design. CSS defines how HTML elements are to be displayed. Styles are normally saved in external .css files. Normally HTML is saved with a .html file extension. I hope this article helps beginners understand how to create a pie chart application using HTML 5 tools.
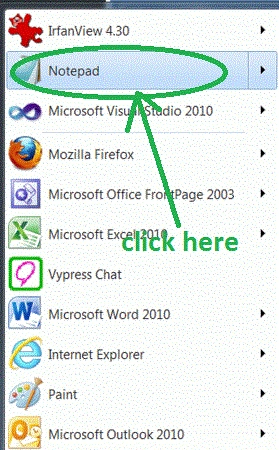
Step 1: First Open an HTML editor such as Notepad.
- Open start->Notepad.
- The name of the editor is "HTML."
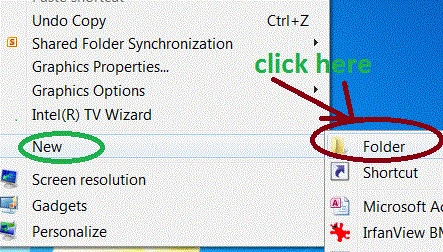
- Right-click on desktop.
- New->add folder.
- Name of the folder is own choice there is "Tom".
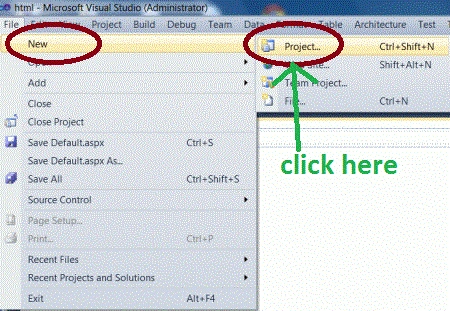
- Go to file -> New->Projects.
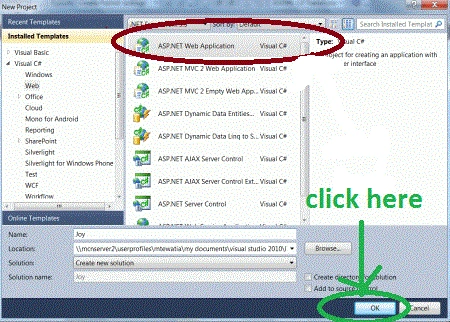
- Open an ASP. NET Web Application.
- Name of "default.aspx".
- Right-click on Solution Explorer.
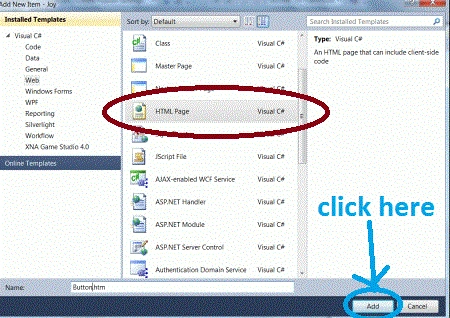
- Add->add new item->HTML form.
- The Name of the HTML form is "pie.html".
Code
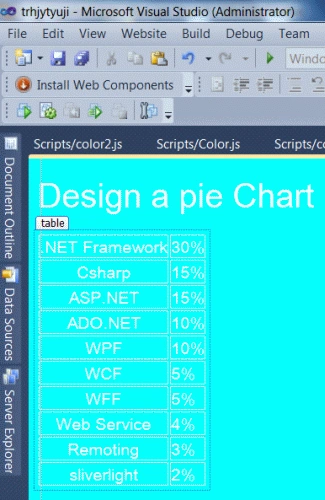 Step 6 : Now some CSS and js files are used in the application.
- <body>
- <h1>Design a pie Chart</h1>
- <table>
- <tbody>
- <tr>
- <th scope="row">.NET Framework</th>
- <td>30%</td>
- </tr>
- <tr>
- <th scope="row">Csharp</th>
- <td>15%</td>
- </tr>
- <tr>
- <th scope="row">ASP.NET</th>
- <td>15%</td>
- </tr>
- <tr>
- <th scope="row">ADO.NET</th>
- <td>10%</td>
- </tr>
- <tr>
- <th scope="row">WPF</th>
- <td>10%</td>
- </tr>
- <tr>
- <th scope="row">WCF</th>
- <td>5%</td>
- </tr>
- <tr>
- <th scope="row">WFF</th>
- <td>5%</td>
- </tr>
- <tr>
- <th scope="row">Web Service</th>
- <td>4%</td>
- </tr>
- <tr>
- <th scope="row">Remoting</th>
- <td>3%</td>
- </tr>
- <tr>
- <th scope="row">sliverlight</th>
- <td>2%</td>
- </tr>
- </tbody>
- </table>
- <div id="holder"></div>
- </body>
-
Color.css: The CSS file helps set text alignment, position, font -size, and background color feature of the pie chart page.
-
Color.js : Color.js is a Javascript file that provides a moving functionality of every part of a pie chart page.
-
Color1.js : Color1.js is a Javascript file that helps to do a partition according to the pixel of a pie chart page.
-
Color2.js : Color2.js is a Javascript file that helps set a color in a pie chart table.
-
Used all above file in an application.
Code
- <link rel="stylesheet" href="Color.css" media="screen"/>
- <script type="text/javascript" src="Scripts/Color.js"></script>
- <script type="text/javascript" src="Scripts/color1.js"></script>
- <script type="text/javascript" src="Scripts/color2.js"></script>
Step 7 : The complete code of a pie chart application.
- <html>
- <head>
- <title> Pie Chart application </title>
- <link rel="stylesheet" href="Color.css" media="screen"/>
- <script type="text/javascript" src="Scripts/Color.js"></script>
- <script type="text/javascript" src="Scripts/color1.js"></script>
- <script type="text/javascript" src="Scripts/color2.js"></script>
- <style type="text/css" media="screen">
- #holder
- {
- margin: -450px 0 0 -450px;
- width: 1000px;
- height: 1000px;
- }
- </style>
- </head>
- <body>
- <h1>Design a pie Chart</h1>
- <table>
- <tbody>
- <tr>
- <th scope="row">.NET Framework</th>
- <td>30%</td>
- </tr>
- <tr>
- <th scope="row">Csharp</th>
- <td>15%</td>
- </tr>
- <tr>
- <th scope="row">ASP.NET</th>
- <td>15%</td>
- </tr>
- <tr>
- <th scope="row">ADO.NET</th>
- <td>10%</td>
- </tr>
- <tr>
- <th scope="row">WPF</th>
- <td>10%</td>
- </tr>
- <tr>
- <th scope="row">WCF</th>
- <td>5%</td>
- </tr>
- <tr>
- <th scope="row">WFF</th>
- <td>5%</td>
- </tr>
- <tr>
- <th scope="row">Web Service</th>
- <td>4%</td>
- </tr>
- <tr>
- <th scope="row">Remoting</th>
- <td>3%</td>
- </tr>
- <tr>
- <th scope="row">sliverlight</th>
- <td>2%</td>
- </tr>
- </tbody>
- </table>
- <div id="holder"></div>
- </body>
- </html>
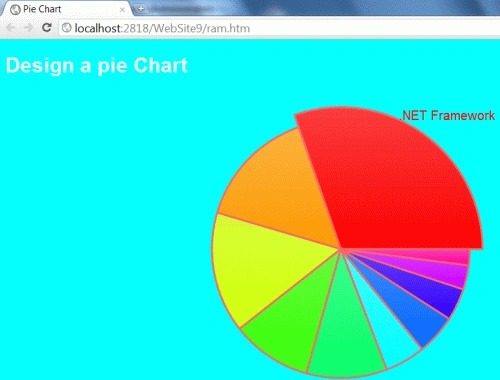
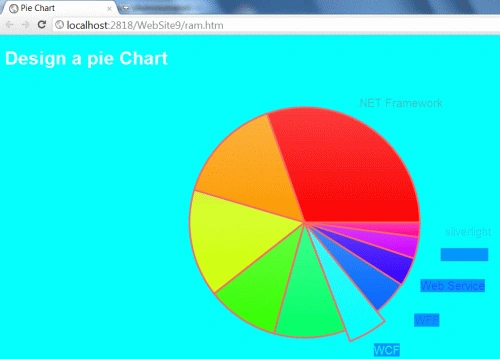
Output
Resources
Gowtham RajamanickamPosted Apr 11, 2015, 1:12 PM
great one
Ismail Hakki SenPosted Sep 2, 2014, 3:14 AM
how it gets values? is it work table based? thanks by the way.
Aaron CronjePosted Feb 1, 2012, 6:04 AM
Good Work... Manish