
In this article, we will see how we can represent SharePoint data in graphical form.
Let's start.
Create a custom SharePoint list 'TaskDetails' with the below details.
Let's start.
Create a custom SharePoint list 'TaskDetails' with the below details.
| Column Name | Type |
| Title | Single line |
| status | Choice |
Add list items into 'TaskDetails'.
Then add the below HTML elements on the page.
- <div>
- <canvas id="AssetStatus" width="500" height="500"></canvas>
- </div>
- <div id="chartjs-legend" class="noselect" ></div>
- <script type="text/javascript" src="jquery-1.7.2.min.js"> </script>
- <script type="text/javascript" src="Chart.js"></script>
- $.ajax({
- url: "<Add SharePoint Site Url>/_api/Web/Lists/GetByTitle('TaskDetails')/items",
- type: "Get",
- headers: {
- "accept": "application/json;odata=verbose",
- },
- success: function (data) {
- LoadChart(data);
- },
- error: function (err) {
- //show error
- }
- });
- var LoadChart = function (data) {
- var items = [];
- var statuses = [];
- var chartData = [];
- var temp = "";
- //Loop through items to find unique statuses
- for (var i = 0; i < data.d.results.length; i++) {
- items.push(data.d.results[i]);
- if (statuses.filter(findStatus(data.d.results[i].status)).length > 0) {
- continue;
- }
- temp = data.d.results[i].status;
- statuses.push(temp);
- }
- function findStatus(arg) {
- return function (items) {
- return items.indexOf(arg) > -1;
- }
- }
- var clrs = ["#3e95cd", "#8e5ea2", "#3cba9f", "#e8c3b9", "#c45850"];
- for (var i = 0; i < statuses.length; i++) {
- var tempCount = items.filter(findStatusInData(statuses[i])).length;
- var object = {
- value: tempCount,
- color: clrs[i],
- label: statuses[i]
- }
- chartData.push(object);
- }
- function findStatusInData(arg) {
- return function (items) {
- return items.status.indexOf(arg) > -1;
- }
- }
- var ctx = document.getElementById('AssetStatus').getContext("2d");
- var chart = new Chart(ctx).Doughnut(chartData, {});
- document.getElementById("chartjs-legend").innerHTML = chart.generateLegend();
- }
The Output will be as below.
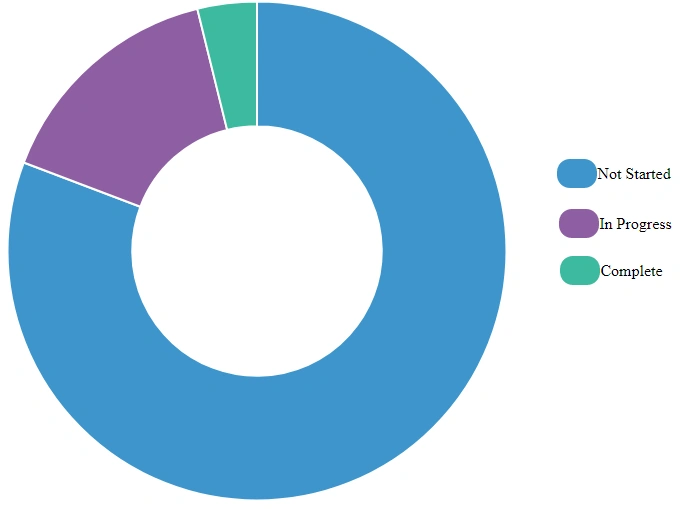
The integrated code will be as below.
The integrated code will be as below.
- <!DOCTYPE html>
- <html lang="en" xmlns="http://www.w3.org/1999/xhtml">
- <head>
- <script type="text/javascript" src="jquery-1.7.2.min.js"> </script>
- <script type="text/javascript" src="Chart.js"></script>
- <script type="text/javascript" >
- $.ajax({
- url: "<Add SharePoint Site Url>/_api/Web/Lists/GetByTitle('TaskDetails')/items",
- type: "Get",
- headers: {
- "accept": "application/json;odata=verbose",
- },
- success: function (data) {
- LoadChart(data);
- },
- error: function (err) {
- //show error
- }
- });
- var LoadChart = function (data) {
- var items = [];
- var statuses = [];
- var chartData = [];
- var temp = "";
- //Loop through items to find unique statuses
- for (var i = 0; i < data.d.results.length; i++) {
- items.push(data.d.results[i]);
- if (statuses.filter(findStatus(data.d.results[i].status)).length > 0) {
- continue;
- }
- temp = data.d.results[i].status;
- statuses.push(temp);
- }
- function findStatus(arg) {
- return function (items) {
- return items.indexOf(arg) > -1;
- }
- }
- var clrs = ["#3e95cd", "#8e5ea2", "#3cba9f", "#e8c3b9", "#c45850"];
- for (var i = 0; i < statuses.length; i++) {
- var tempCount = items.filter(findStatusInData(statuses[i])).length;
- var object = {
- value: tempCount,
- color: clrs[i],
- label: statuses[i]
- }
- chartData.push(object);
- }
- function findStatusInData(arg) {
- return function (items) {
- return items.status.indexOf(arg) > -1;
- }
- }
- var ctx = document.getElementById('AssetStatus').getContext("2d");
- var chart = new Chart(ctx).Doughnut(chartData, {});
- document.getElementById("chartjs-legend").innerHTML = chart.generateLegend();
- }
- </script>
- <style type="text/css">
- ol,
- ul {
- list-style: none;
- margin: 0;
- padding: 0;
- text-align: center;
- }
- li {
- display: inline-table;
- }
- .noselect {
- -webkit-touch-callout: none;
- -webkit-user-select: none;
- -khtml-user-select: none;
- -moz-user-select: none;
- -ms-user-select: none;
- user-select: none;
- }
- #chartjs-legend {
- position: absolute;
- width: 100%;
- bottom: 10%;
- }
- #chartjs-legend li {
- cursor: pointer;
- margin: 10px 4px;
- }
- #chartjs-legend li span {
- position: relative;
- padding: 6px 20px;
- border-radius: 13px;
- color: white;
- z-index: 2;
- }
- </style>
- <meta charset="utf-8" />
- <title></title>
- </head>
- <body>
- <div>
- <canvas id="AssetStatus" width="500" height="500"></canvas>
- </div>
- <div id="chartjs-legend" class="noselect" ></div>
- </body>
- </html>
Anupama KPosted Apr 19, 2021, 2:07 PM
Threw error at this point - : Cannot read property 'indexOf' of undefined : function findStatusInData(arg) { return function (items) { return items.Status.indexOf(arg) > -1; --> Uncaught TypeError } }
Imran AliPosted Jun 24, 2019, 3:14 PM
Hi, I have tried and it did not work, did it work for anyone?
Ram TPosted Jan 3, 2018, 11:26 AM
I used Chart Js Plugin. Can you please let me know
Ram TPosted Jan 3, 2018, 11:25 AM
I got same error. SCRIPT438: Object doesn't support property or method 'Doughnut'
Prabhu NehruPosted Aug 28, 2017, 6:35 AM
Getting an error "object doesn't support property or method 'Doughnut'"