

Pie-Charts
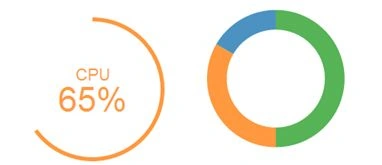
- Create index.html and copy paste below code:
In above code base, you will notice, references for D3.js, angular.min.js, and pie-chart.js
- <!DOCTYPE html>
- <html lang="en">
- <head>
- <title>Pi Chart Samples</title>
- <meta charset="utf-8">
- <meta name="viewport" content="width=device-width, initial-scale=1">
- <link rel="stylesheet" href="http://maxcdn.bootstrapcdn.com/bootstrap/3.3.5/css/bootstrap.min.css">
- <script src="https://ajax.googleapis.com/ajax/libs/jquery/1.11.3/jquery.min.js"></script>
- <script src="http://maxcdn.bootstrapcdn.com/bootstrap/3.3.5/js/bootstrap.min.js"></script>
- </head>
- <body ng-app="chartapp" ng-controller="MainController">
- <div class="container">
- <div class="page-header">
- <h2>
- Pi Chart Samples</h2>
- </div>
- <div class="row">
- <div class="col-lg-4">
- <div class="panel panel-default">
- <div class="panel-heading">
- <span class="glyphicon glyphicon-equalizer"></span>CPU Performance
- </div>
- <div class="panel-body">
- <div style="height: 200px;">
- <pie-chart data="data" options="options"></pie-chart>
- </div>
- </div>
- </div>
- </div>
- </div>
- <script src="https://cdnjs.cloudflare.com/ajax/libs/angular.js/1.5.0/angular.min.js"></script>
- <script src="https://cdnjs.cloudflare.com/ajax/libs/d3/3.5.16/d3.min.js"></script>
- <script src="pie-chart.min.js"></script>
- <script src="app.js" type="text/javascript"></script>
- </body>
- </html>
As a standard, I am displaying my chart in a bootstrap panel.To generate and render pie-chart, the following directive is important,- <pie-chart data="data" options="options"></pie-chart>
- Behind this index.html, we have our AngularJS based implementation in our app.js.
Refer our app.js as below,
- var chartapp = angular.module('chartapp', ['n3-pie-chart']);
- chartapp.controller('MainController', function($scope) {
- $scope.options = {
- thickness: 5,
- mode: "gauge",
- total: 100
- };
- $scope.data = [{
- label: "CPU",
- value: 20,
- color: "#ff7f0e",
- suffix: "%"
- }];
- //Function added to appear our guage chart as if it is showing data real time.
- setInterval(function() {
- $scope.data[0].value = parseInt((0.5 + Math.random() * 0.5) * 100);
- $scope.$apply();
- }, 2000);
- });
- Open index.html in a browser and see how the gauge indicator is showing CPU performance in a very elegant manner. We also have added a flavor of real-time to this gauge using setInterval().
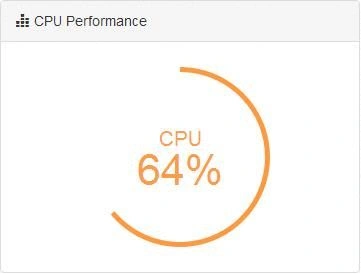
So this way we can visualize our data with such gauges and make it more intuitive along with passing the intended message to users in real-time.
Madan BhintadePosted Mar 27, 2016, 2:58 PM
Sending above path for chart.min.js
Madan BhintadePosted Mar 27, 2016, 2:57 PM
https://github.com/n3-charts/pie-chart/tree/master/dist
Pradeep SahooPosted Mar 18, 2016, 8:33 PM
Hi Madan , <pie-chart is giving me error , where can I get pie-chart.min.js
Madan BhintadePosted Mar 15, 2016, 7:55 AM
Here you go...https://github.com/n3-charts/pie-chart/tree/master/dist
Andy SmithPosted Mar 15, 2016, 5:33 AM
Looks like a nice example - thanks! Your example is looking locally for pie-chart.min.js . Do you have a link to that file?