

In this blog you will learn about building HighCharts using SharePoint online lists using JavaScript REST API dynamically in 3 simple steps.
Happy Coding!!
Prerequisites
- SharePoint List
- Get the code files from my GitHub
Step 1 - Get SharePoint list items using REST API GET Method
- function getItems() {
- $.ajax({
- url: _spPageContextInfo.webAbsoluteUrl + "/_api/web/lists/getbytitle('LeaveTracker')/items?$top=500&$select=Status",
- type: "GET",
- headers: {
- accept: "application/json;odata=verbose",
- },
- success: function (data) {
- var items = data.d.results;
- for (var i = 0; i < items.length; i++) {
- var statusVar = items[i].Status;
- statusArray.push(statusVar);
- }
- fnDataArray();//Get Unique Status Count & Dataset for HighChart
- buildhighcharts();// Build Bar Chart
- },
- error: function (error) {
- console.log(error);
- },
- });
- }
Step 2 - Create Dataset for Highchart
- function fnDataArray() {
- var StatusObj = statusArray.reduce(function (count, status) {
- if (typeof count[status] == "undefined") {
- count[status] = 1;
- } else {
- count[status] += 1;
- }
- return count;
- }, {});
- console.log(StatusObj);
- //Object Output -> {Open: 1, InProgress: 2, Completed: 1}
- //Get the values from our object
- var DataName = Object.keys(StatusObj);
- var DataCount = Object.values(StatusObj);
- ObjProperty = Object.getOwnPropertyNames(StatusObj);
- for (var i = 0; i < ObjProperty.length; i++) {
- DataSet.push({
- name: DataName[i],
- data: [DataCount[i]],
- });
- }
- }
Step 3 - Build HighChart Bar Chart
- function buildhighcharts() {
- if (ObjProperty.length > 0) {
- $("#BarChart").highcharts({
- credits: {
- enabled: false,
- },
- chart: {
- type: "column",
- },
- title: {
- text: null,
- },
- xAxis: {
- visible: false,
- },
- yAxis: {
- min: 0,
- title: {
- text: "No. of Requests",
- },
- },
- tooltip: {
- formatter: function () {
- return this.series.name + " : " + this.y;
- },
- },
- plotOptions: {
- column: {},
- },
- series: DataSet, //Data for chart
- });
- } else {
- $("#BarChart").highcharts({
- title: {
- text: "No data to display!",
- },
- });
- }
- }
Refer to this URL for more info for bar charts,
- https://www.highcharts.com/demo/bar-basic
- https://jsfiddle.net/gh/get/library/pure/highcharts/highcharts/tree/master/samples/highcharts/demo/bar-basic
Screenshot
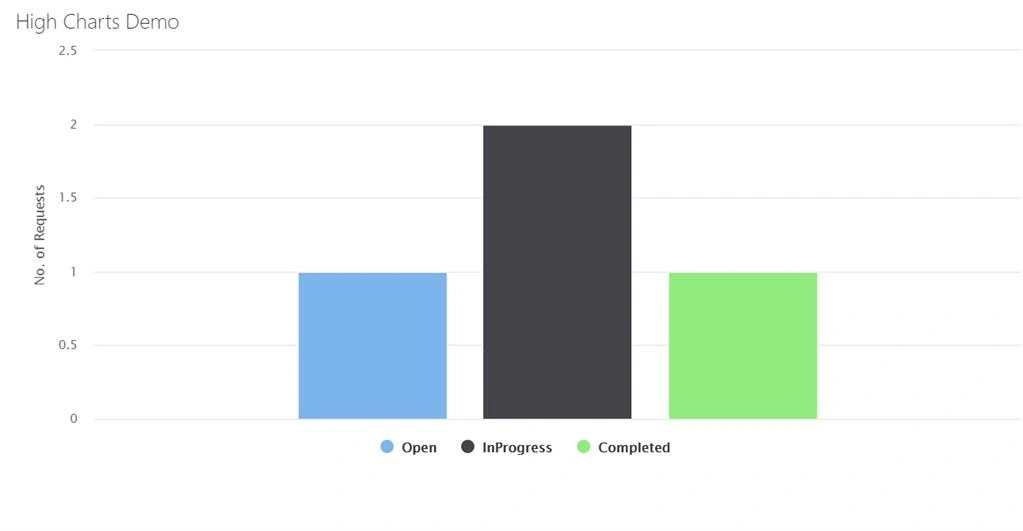
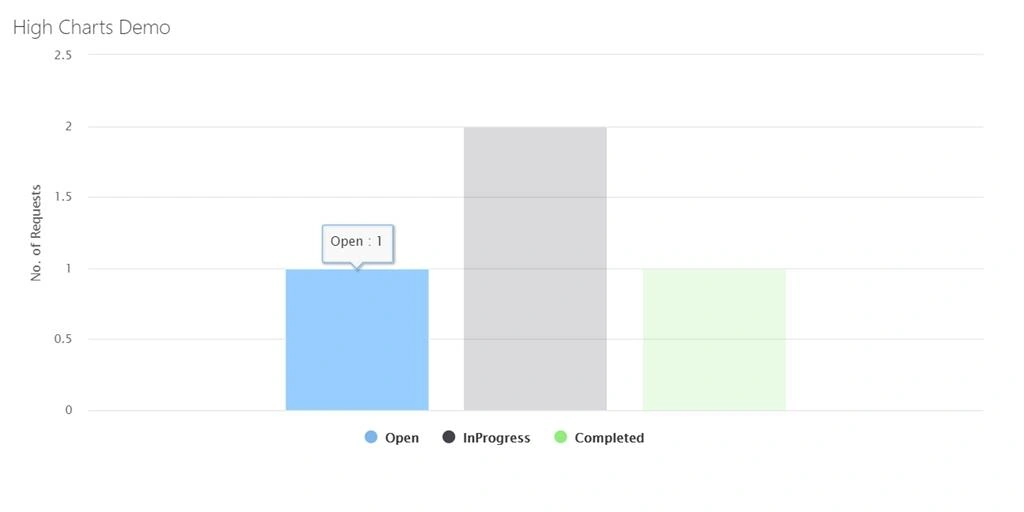
Hope you guys find this blog useful!!
Happy Learning!!
Join the conversation! Your thoughts help the community grow.