

This article teaches you about a most effective tool for Business Intelligence that is provided by Microsoft; i.e. Power BI. Before learning Power BI, you need to understand the term Business Intelligence. Business intelligence can be used by enterprises to support a wide range of business decisions ranging from operational to strategic. BI is most effective when it combines data derived from the market in which a company operates (external data) with data from company sources internal to the business such as financial and operations data (internal data).
What is BI (Business Intelligence)
As per Wikipedia ”Business intelligence (BI) comprises the strategies and technologies used by enterprises for the data analysis of business information. BI technologies provide historical, current, and predictive views of business operations. BI technologies can handle large amounts of structured and sometimes unstructured data to help identify, develop, and otherwise create new strategic business opportunities.”
What is Power BI
Microsoft Power BI is a business intelligence platform that provides you with a number of analysis tools for aggregating, analyzing, visualizing and sharing data. Power BI users can create interactive reports, and access data while on the move through portable applications. Its profound incorporation with other Microsoft items makes it an adaptable self-administration device that requires minimal forthright preparing.

Power BI can be basic and quick, fit for making speedy experiences from an Excel exercise manual or a local database. In any case, Power BI is vigorous, not only able to perform broad display and real-time analytics, but also suitable for custom development. Consequently, it may be your own report and perception device, yet can likewise serve as the analytics and decision engine behind group projects, divisions, or entire corporations.
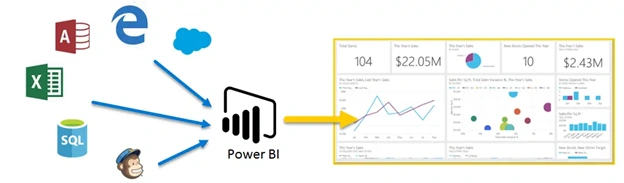
Power BI is the market leader in solving data management crises. This tool is mainly aimed to help organizations and individuals organize their data.
Power BI is the aggregate name for an arrangement of cloud-based applications and administrations that help associations examine, oversee, and dissect information from an assortment of sources, through a user-friendly interface.
The Parts of Power BI
Power BI can be categorized into three main categories
- Power BI Desktop – An application that runs on Windows
- Power BI Services – An online service called SaaS (Software as a Service)
- Mobile App – A mobile app that runs on Windows, iOS and Android devices.
All these elements are used to create and share business reports, work dashboard etc. These applications are also designed to let you consume business insights in a very interactive way.
There are some more elements of Power BI.
- Power BI Report Builder
It is used to create paginated reports to share in the Power BI Services.
- Power BI Report Server
It is an on-premises report server that is used to publish the reports created on Power BI Desktop.
Comparison between Power BI Desktop and Services
|
Power BI Desktop
|
Power BI Services
|
|
1. It is a data analysis and report creation tool that can be install for free on your PC
|
It is a cloud-based service, which supports report editing and collaboration for teams.
|
|
2. It has Visualization, security, filters, R visuals etc.
|
It also has Visualization, security, filters, R visuals etc.
|
|
3. Many types of data sources are in Power BI Desktop.
|
Power BI Services support few data sources
|
|
4. You can combine different sources in data model, transform data in Power BI Desktop.
|
Modeling is limited, but you can create Dashboards, Apps and Workspace.
|
|
5. You can calculate columns and measure into the table using Power BI Desktop.
|
Data flow can be created in Power BI Services.
|
Architecture of Power BI
Data Integration
As Power BI supports many different data sources it needs to be integrated. Organizations work with data that comes from many different sources and formats. This data needs to be extracted from these sources, servers and databases and then integrated into a standard format.
Data Processing
We cannot used integrated data directly for visualization as the data needs processing. Here we perform editing, transforming and modeling of data. For example – remove blank, add measures or calculated column. We can also add functions here in this step. Business rule can also be applied here as required.
Data Presentation
After loading and transforming the data now here we need to represent it as the business needs it. Power BI supports many visuals to represent our data in a very attractive manner. Representation is very useful to understand the information that we shared. It is also very useful to take business decisions.
Power BI Components
Power Bl Desktop is used to generate dashboards and reports. Power Bl applications will be accessed by other users through desktop and mobile devices.
There are 5 main components in Power BI.
- Power Query
Power Query is used to transform data by using functions and DAX queries.
- Power Pivot
It is used for data modeling for in-memory analytics.
- Power View
Through this component you can visualize, analyze, and represent data.
- Power Map
This component allows geographical visualization of data.
- Power BI Service
On-premises and cloud-based data service allows you to create workspace and dashboard. It is also used for publishing reports.
- Power BI Q&A
It allows you to ask questions and get immediate answers using a natural language query.
- Data Management Gateway
It is used to refresh data in the cloud. Through this gateway you can connect your on-premise server with Power BI in the cloud
- Data Catalog
This component allows you to create and share queries. Metadata can be facilitated for search functionality
Features Of Power BI
- Power BI utilizes Content Packs, which have dashboard reports, information model and inserted questions. Content Packs are currently being utilized by an enormous number of utilizations, including QuickBooks.
- This is one of the most integral assets in Power BI. Characteristic Language Q&A permits clients to compose questions and gives the substance and answer, which can be controlled to coordinate your visual need.
- It's a library of custom representation. In the event that the business needs are extraordinary, at that point the visuals should be also.
- With Power BI, organizations can get information from, for all intents and purposes, anyplace. Power BI Desktop incorporates a colossal cluster of on-premise and cloud information sources, organized and unstructured, with more included every month.
- Power BI is Microsoft's cloud-based BI arrangement that conveys a total self-administration BI arrangement intended to dissect and picture information over your whole business.
- With Power BI, your information can rapidly be changed over to data and knowledge, on which you can base future choices and techniques. Gather and get information ready and perform compelling and sensible reports in only a couple of moments.
- All ventures produce enormous amounts of information consistently, yet by what means can this information be utilized to make an outline of your industry? In Power BI you will locate various industry arrangements that permit you to consolidate information and find new industry bits of knowledge and information that can be shared over the organization.
Working of Power BI
In power BI, you should first connect your data to the tool, transform the data, model your data, visualize your data, and share the results generated by Power BI.
Connecting Your Data
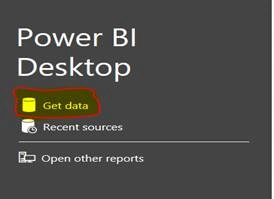
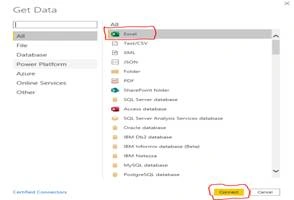
You can connect variety of data from various data sources like MySQL Server, MySQL, Oracle, etc. in two ways either upload your file to Power BI or import the file into Power BI.
Uploading your file to Power BI
Connect to the data in your workbook so that you can create Power BI reports and dashboards for it.
Importing your file into Power BI
In order to view your file, you will have to fetch it in Power BI, and you can interact with it just as you would do in the case of Excel Online.
Transforming Your Data
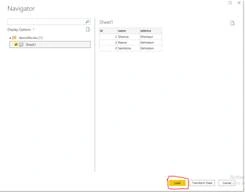
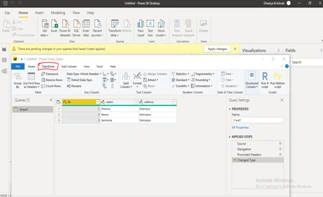
Once your data is loaded, you can transform the data as per your need. You can do this by using the Transform menu. It has a set of operations like reverse rows, count rows, rename, replace values and errors, pivot and unpivot columns, etc.
Modeling Your Data
In Power BI desktop, you can add some functions, calculations, relationships, measures, etc. to your data for better visualization and analytics so that it can be used for business insights. You can even write a query to your files so that you can accomplish different tasks in a short duration of time.
Data Visualization
Here, you can create your reports, dashboards, etc. based on your modeled data and depending on the company’s requirement. Report creation can be done in many ways, you need to select any field you want from your CSV file or data file and then choose the tool you want to give to your data so as to generate the desired report. You can use a variety of tools and even add a custom visual gallery effectively.
Sharing the Generated Reports
You can share or publish your reports securely using Power BI Services and set up automatic data refresh. You can do this by the Publish menu. It provides near real-time analytics of trends and indicators for everyone.
Disadvantages of Power BI
Here, are Cons/drawbacks of using Power BI are:
- Access Limitation
Dashboards and reports are only shared with users who logged in with the same email address.
- Real-Time Data Import
Power Bl will not mix imported data, which is accessed from real-time connections.
- File Size Limit
Power Bi cannot accept zip file which compressed by the data of X-velocity in-memory database.Power BI also can't import file size larger than 1 GB.
- Parameter Limitation
Dashboards never accept or pass user, account, or other entity parameters.
- Real-Time Connections Limitations
There are very few data sources that allow real-time connections to Power BI reports and dashboard.
Power BI Highlights
- Power BI allows you to analyze data and to provide useful information which helps corporate executives, business managers to make required business decisions.
- Power BI is a Business Intelligence and Data Visualization tool which helps you to import data from a different data source.
- Most important Power BI Elements are,
- Power BI Desktop
- Power BI service
- Power BI Data Gateway
- Power BI Report Server
- Power BI Report Builder
- Power BI Mobile Apps
- The important data sources used in Power BIare Excel (.xlsx, xlxm), Comma Separated Value (.csv), Power BI Desktop (.pbi)(.pbi is the file extension), Databases in the Cloud, Databases on-premises.
- Visualization, Datasets, Dashboard, Reports, Tile are important building blocks used in Power BI. To know more in detail please check here.
- This application was originally conceived by Thierry D'Hers and Amir Netz of the SQL Server Reporting Services Team at Microsoft.
- You can transform data after loading into the Power Bi desktop, also perform data modeling by adding measure or calculated columns like conditional column, index column or custom column etc.
- The important components of Power BI architecture are,
- Data Integration
- Data Processing
- Data Presentation
- DAX is a formula expression language which is called (DAX) which can be used with various visualization tools like Power BI.
- Power BI offers Complete Dashboards for analysis, while Tableau only allows Ad Hoc Analysis.
- Power BI is used by PMO - Project and Portfolio Manager, Business & Data Analyst, IT Team, IT Professional, etc.
- The biggest drawback for Power Bi is that it will not accept a file larger than 1GB and zip files which are compressed by the data of X-velocity in-memory database.
Summary
In this article you learned Power BI is, and what the components of Power BI are, its limitations, parts and about its architecture. I hope this article will help you out with Power BI in detail. To know more about Power BI please stay with us. Thank you so much for reading this article. Have a nice day.
Join the conversation! Your thoughts help the community grow.