
Introduction
In this post, I will explain to you how to create charts with ChartistJS plugin with ASP.NET MVC 4, using C#, Entity framework and JSON.
What is CHARTIST?
- Chartist.js is the product of a community which was disappointed about the abilities provided by other charting.
The following facts should give you an overview about why to choose Chartist as your front-end chart generator:- Simple handling, while using convention over configuration.
- Great flexibility, while using clear separation of concerns (Style with CSS & control with JS).
- Usage of SVG (Yes! SVG is the future of illustration in Web!).
- Fully responsive and DPI independent.
- Responsive configuration with the media queries.
- Fully built and customizable with Sass.
Let’s start to create our first responsive chart, using ChartistJS in ASP.NET MVC.
Download ChartistJS library and CSS files
You can download the library included in JS and CSS files directly from the Chartist-js Website.
- <!-- CSS -->
- <link href="~/Content/chartist.min.css" rel="stylesheet" />
- <!-- Scripts JS -->
- <script src="~/Scripts/chartist.min.js"></script>
- <script src="~/Scripts/jquery-1.7.1.min.js"></script>
Create Table
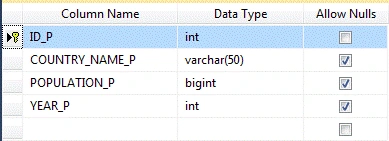
You will find the table, given below, used in our Application:
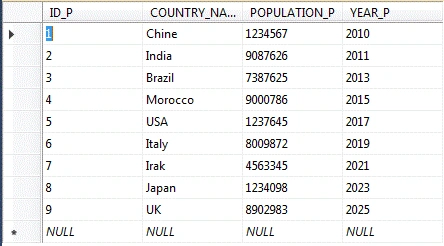
After creating the table, you can fill it, using the data, as shown below:
Create your MVC Application
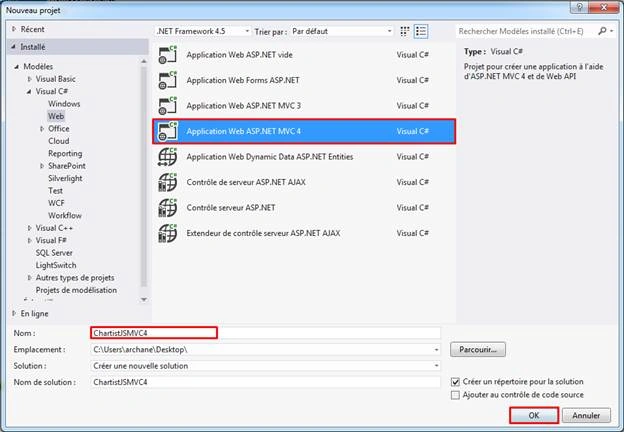
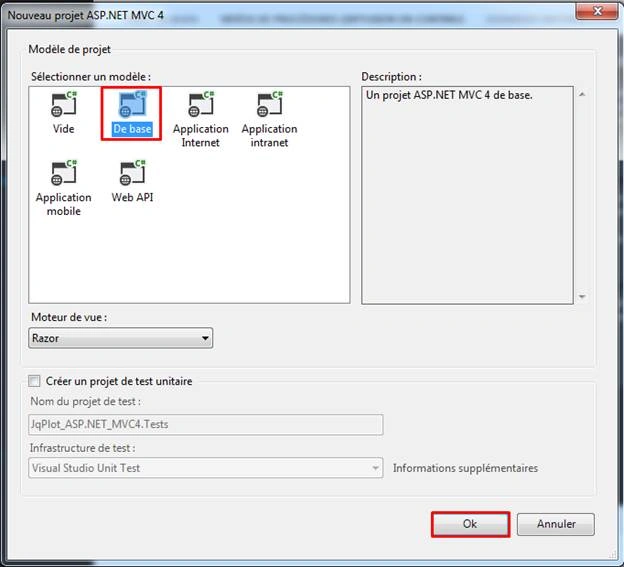
Open Visual Studio. Click File > New > Project and name your project, as shown below:
Creating ADO.NET Entity Data Model
Now, we need to create an Entity Data Model, which allows us to retrieve the data from the database.
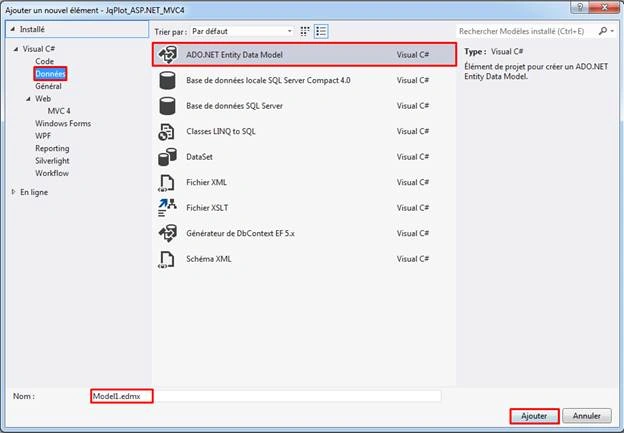
Right click on the project name. Click Add > Add New Item. In the dialog box displayed, select Data > click Add button.
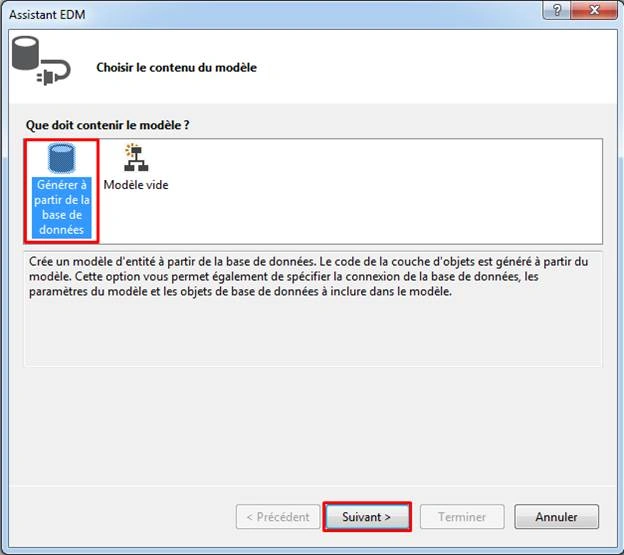
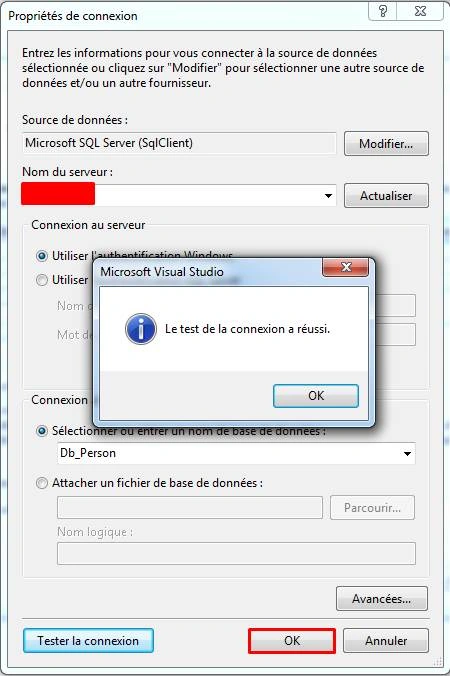
After clicking Next button, the dialog box will be displayed, as shown below. You need to choose your Server name and select your database.
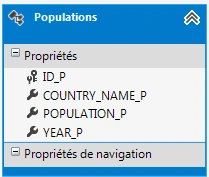
Finally, we see that EDMX model will generate Populations class.
Create a controller
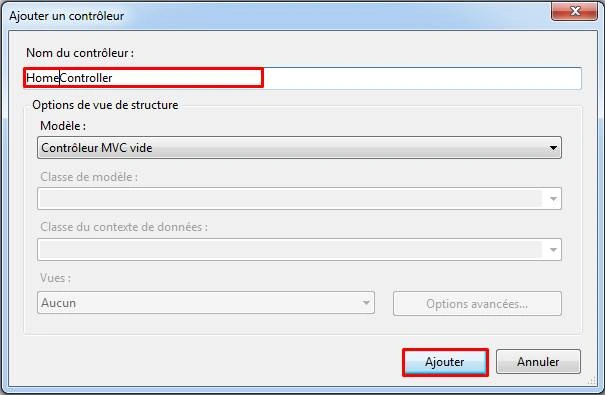
We proceed to create a controller. Right click on the controller folder > Add > Controller > enter Controller name (‘Home Controller’).
HomeController.cs
- using System;
- using System.Collections.Generic;
- using System.Linq;
- using System.Web;
- using System.Web.Mvc;
- namespace ChartistJSMVC4.Controllers
- {
- public class HomeController : Controller
- {
- //DbContext
- private Db_PersonEntities db = new Db_PersonEntities();
- //
- // GET: /Home/
- public ActionResult Index()
- {
- return View();
- }
- public ActionResult GetPopulation()
- {
- var DbResult = from d in db.Populations
- select new
- {
- d.COUNTRY_NAME_P,
- d.POPULATION_P
- };
- return Json(DbResult, JsonRequestBehavior.AllowGet);
- }
- }
- }
Creating a strongly typed view
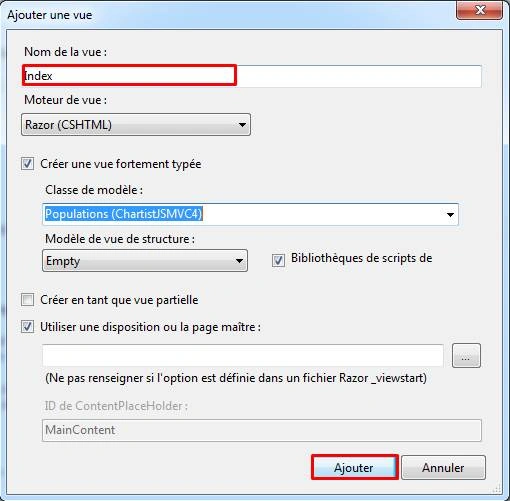
We are going to create a strongly typed view.
Index.cshtml
- @model ChartistJSMVC4.Populations
- @{
- ViewBag.Title = "Chartist MVC 4";
- }
- <h2>Chartist MVC 4 </h2>
- <div class="ct-chart ct-golden-section"></div>
- @section scripts{
- <!-- CSS -->
- <link href="~/Content/chartist.min.css" rel="stylesheet" />
- <!-- Scripts JS -->
- <script src="~/Scripts/chartist.min.js"></script>
- <script src="~/Scripts/jquery-1.7.1.min.js"></script>
- <script type="text/javascript">
- $(document).ready(function () {
- $.ajax({
- type: "POST",
- url: "Home/GetPopulation",
- contentType: "application/json; charset=utf-8",
- dataType: "json",
- success: OnSuccess,
- error: OnError
- });
- function OnSuccess(response) {
- var result = response;
- var arrayLabels = [], arraySeries = [];
- $.map(result, function (item, index) {
- arrayLabels.push(item.COUNTRY_NAME_P);
- arraySeries.push(item.POPULATION_P);
- });
- var data = {
- labels: arrayLabels,
- series: arraySeries
- }
- new Chartist.Pie('.ct-chart', data, { donut: true });
- }
- function OnError(response) {
- alert("Error !");
- }
- });
- </script>
- }
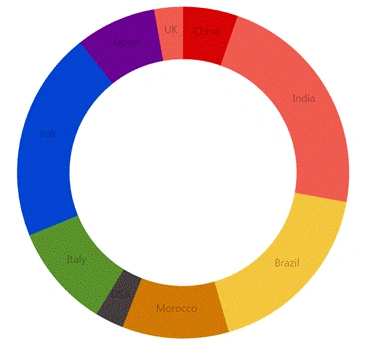
For any details related to ChartistJS, you can use the link, given below:
URL: Chartist-js
Muhammad Aqib ShehzadPosted Jul 28, 2016, 8:16 AM
Very nice share. keep sharing
Shobana JPosted Jul 28, 2016, 7:10 AM
Nice
Vignesh ManiPosted Jul 28, 2016, 6:42 AM
Good
Raja TPosted Jul 28, 2016, 4:30 AM
Good, Thanks for sharing..
Manas MohapatraPosted Jul 27, 2016, 11:48 PM
Good to know about new library CHARTIST.js for creating charts..
Prasanna MuraliPosted Jul 27, 2016, 9:36 PM
Nice share