

Introduction
This article is a brief description of what the NetBeans Profiler provides so that one is thoroughly familiar with the functioning and usage of this module of the NetBeans IDE. It is a guide to quickly start profiling your NetBeans IDE.
NetBeans Profiler
The NetBeans Profiler is a monitoring tool for Java applications. The profiler offers full-featured profiling functionality of the NEtBeans IDE, they are as follows:
- Thread state
- CPU performance
- memory usage
- Find memory leaks
The NetBeans Profiler provides important information about the runtime behaviour of your application. All the profiling features of the NetBeans IDE are not covered and it doesn't reveal how to interpret profiling results to overcome the specific performance issues in your application program.
Using Profiler Module
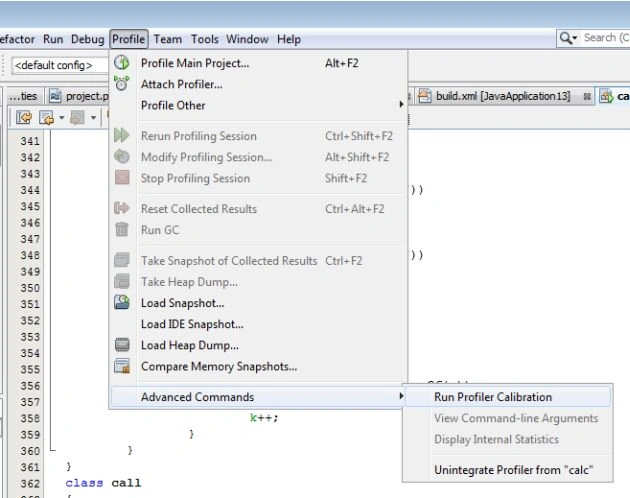
To start an accurate profiling session, collaboration data for all the Java platforms must be present for use. Create a new project or select any of your existing projects from the project window and proceed using the following.
- Select the "Profile" from the menu bar then select "Advance Command" -> "Run Profile Collaboration" as in the following:
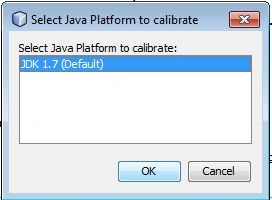
- Choose Java Platform and click "OK"
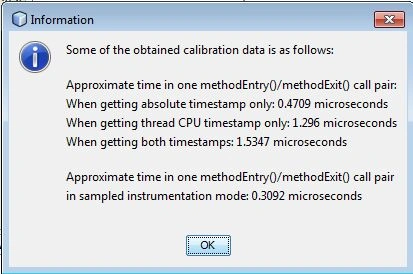
- After completion of the collaboration process, a dialog box will appear with a "Show Details" button, which gives all the information about the collaboration results.
Selecting a Profiling Task
There are basically three tasks performed by the profiler module of NetBeans IDE; they are:
- Monitor Application
- Analyze CPU Performance
- Analyze Memory Usage
The main interface for running a profiling task is the dialog box for selecting the profile task, which requires us to choose the task depending on the profiling information we need.
Monitoring an Application
After monitoring an application high-level information is obtained about important properties of the target Java Virtual Machine(JVM). Use the following procedure to monitor your application.
- First of all, see that your application is set as the main project.
- Select the "Profile Main Project" from the "Profile" main menu. The following Profiling Task dialog box will appear.
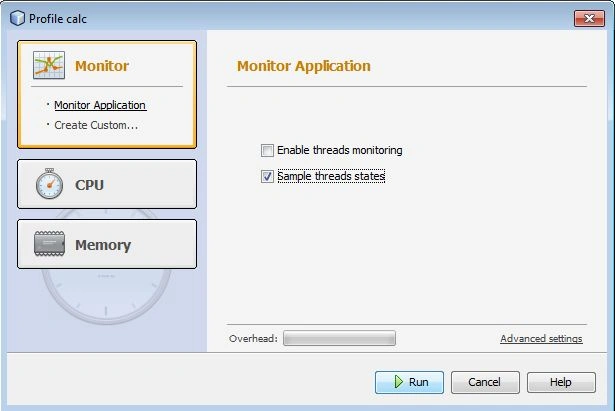
- Click on the "Monitor" from the profiling dialog box and click "Run".
- After clicking on the "Run" button, the IDE launches the Profiler window, which opens on the left pane of the IDE. The Profiler window will provide you the following functions:
- Manage Profiling result screenshots
- Show Profiling Results
- Controls Profiling Tasks
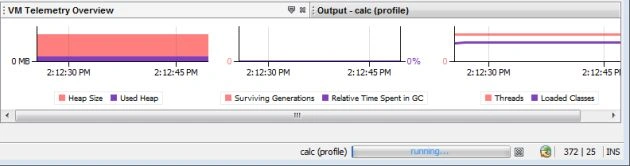
The result is shown in the following screenshot:
Analyzing CPU Performance
To analyze CPU performance, we need to determine how the application is profiled by choosing one among the following two methods:
- Entire application: In this method, the IDE takes samples and considers a stack trace periodically. This method is not so precise, it only makes you identify the method you want to instrument.
- Part of application: In this method, the methods of the application are instrumented. This method is more precise than the previous method since it specifies the time taken by each method of the application. When the thread enters the method, it generates a "method entry" event and as well as a "method exit" event at the time of exit.
Now use the following procedure to analyze the CPU Performance:
- Stop the previous Profiling session if it is still running, by clicking on "Stop Profiling Session" in the "Profile" main menu.
- Now choose the "Profile Main Project" from the "Profile" main menu and select CPU From the Profile dialog box.
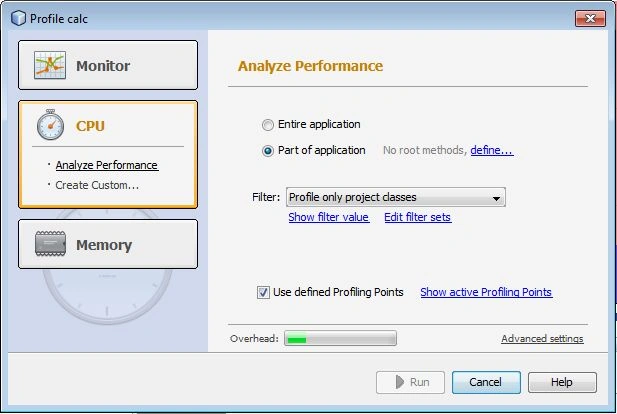
- Select "Part of application", to use this option we need to specify profiling root method so choose it from the customize option and edit the "profiling roots".
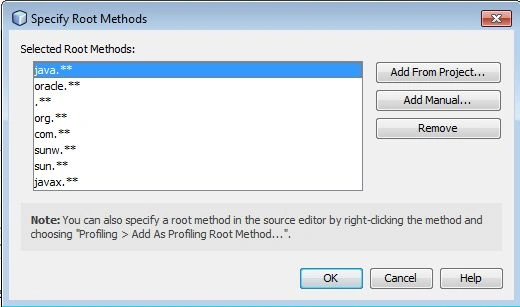
- And finally, click on the "Run" button of the profiling dialog box.
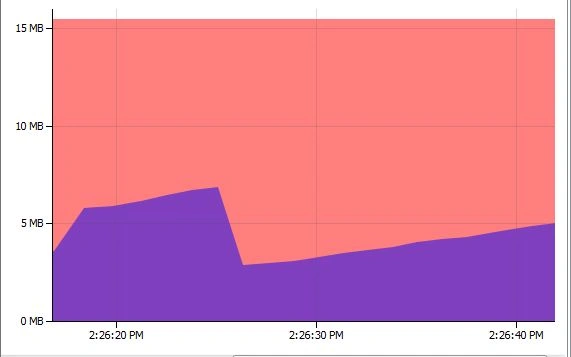
- After this, the IDE launches the application and starts the profiling session. Click Live Results in the Profiler window to view the profiling results. It shows the profiling data collected so far. The screenshot is shown below.
Analyzing Memory Usage
Use the following procedure to analyze Memory Usage:
- Stop the previous profiling sessions is still running.
- Click on the "Profile Main Project" from the "Profile" main menu.
- A Profiling Task Dialog Box will appear after accomplishing the preceding step, click on Memory.
- Select advance and proceed further according to the screenshot below.
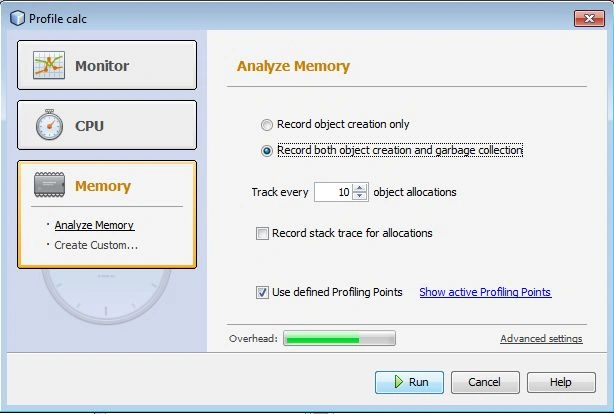
- To analyze the Memory Usage you need to select one among the two following actions:
- Record object creation only
- Record both object creation and garbage collection
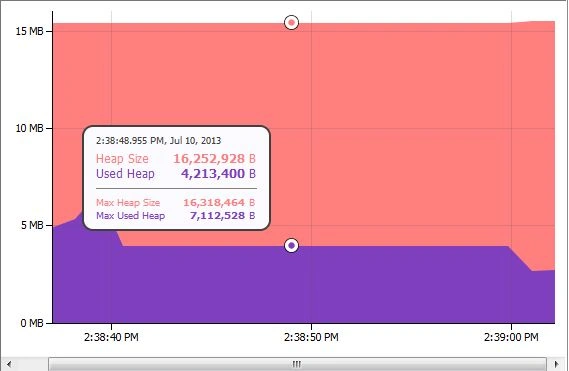
- Finally, click on Run and the IDE launches the application and the profiling session begins. The result is sorted by default and is shown in the screenshot below.
Join the conversation! Your thoughts help the community grow.