

As of now, there is no way to create a dashboard in Power BI, which can give us an overview of much-needed information including which flows have been executed and what is the current status of all the flows at the organizational level. And there is definitely no way to share the exact status of the events which have been triggered and need action from the end-users.
Scenario
During one of my implementations of undertaking the automation in an organization, one of the much-needed requirements was to create a "since" dashboard to display the entire information of all the flows, such as - the status of tasks which have been created along with their time to get completed and the time of achieving a task.
Something like this -
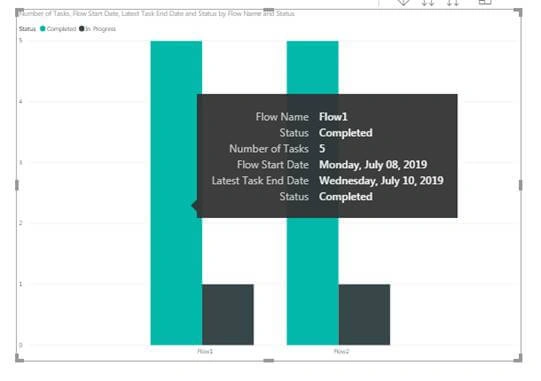
Screen 1
Representing the flows along with the details of tasks.
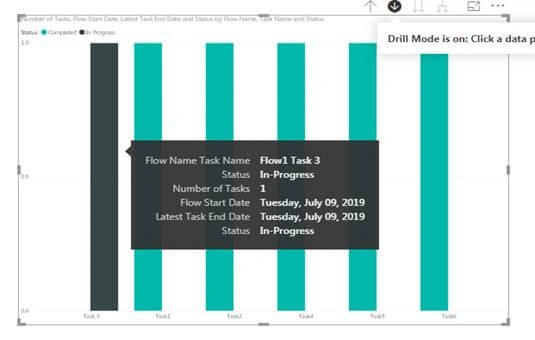
Screen 2
It’s a drill down, i.e., on the click on the bar, the associated tasks with that flow will be visible to the end-user.
Approach undertaken
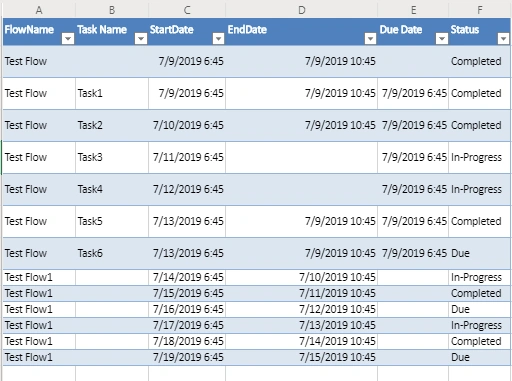
- Included steps in Microsoft Flows to create and update entries in Excel (Business online) before each and every event
- Included steps in the Microsoft Flows to update the rows which have been created from the above step with specific details like Date Completed and comments if any
- Something similar to what one needs to create logs in a C# program. Along the same lines, I have created and maintained my own database with logs for the execution of Microsoft Flows for the entire flow along with tasks.
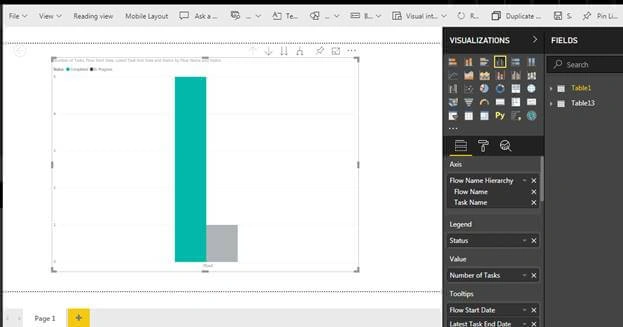
And now comes the Power BI part over which I have created a dashboard which includes the following steps.
- Selecting the data source – which, in my case, is the Excel file that's been generated over the execution of Microsoft Flows.
- Selection of the dataset using which I have been creating the dashboard.
End Result
Full-fledged dashboard for all the flows which are being executed in Microsoft Flows with real-time analysis.
Join the conversation! Your thoughts help the community grow.