

Introduction
Performance is one of the key factors that determines the success of a web application. Even if your application is functionally correct, slow page loads or delayed interactions can negatively impact the user experience. While dedicated tools such as Lighthouse, k6, JMeter, and Locust are commonly used for performance and load testing, Playwright can also help you monitor frontend performance metrics during UI automation. In this article, we'll explore how to collect performance metrics using Playwright and build a reusable performanceHelper.ts utility.
Why Measure Performance During UI Tests?
Adding performance checks to your UI automation helps you:
Detect performance regressions early
Monitor page load times
Measure API response durations
Track frontend rendering performance
Validate Core Web Vitals in CI/CD pipelines
Although Playwright is not a load-testing tool, it is excellent for measuring browser-side performance.
What Can Playwright Measure?
Playwright provides access to the browser's Performance API, allowing you to measure:
Navigation time
DOM Content Loaded time
Page Load time
First Paint
First Contentful Paint (FCP)
Largest Contentful Paint (LCP)
API response times
Custom user interaction durations
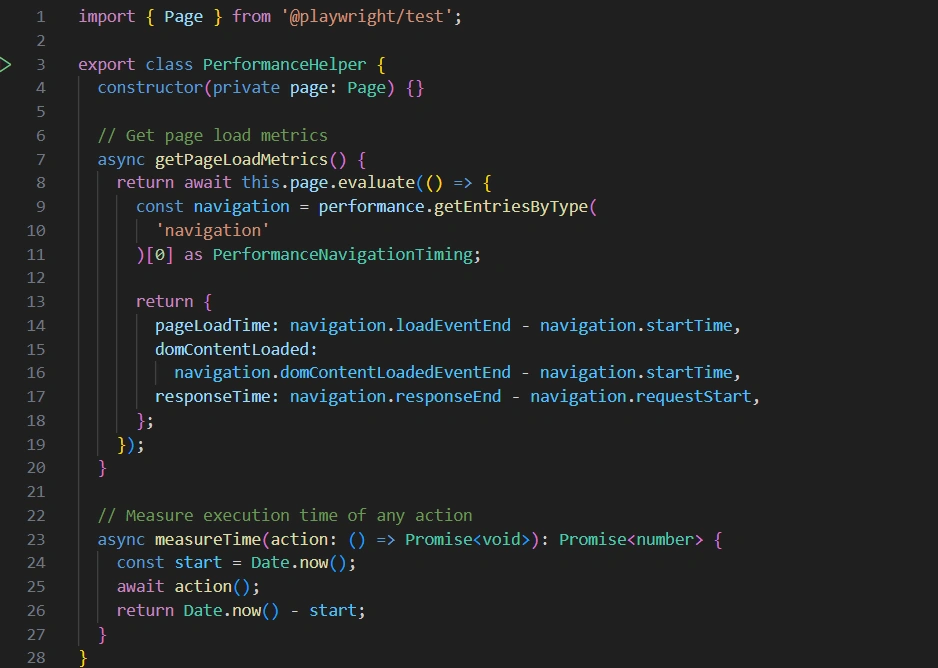
Creating a Performance Helper
Instead of duplicating performance logic across tests, create a reusable helper.
Using the helper
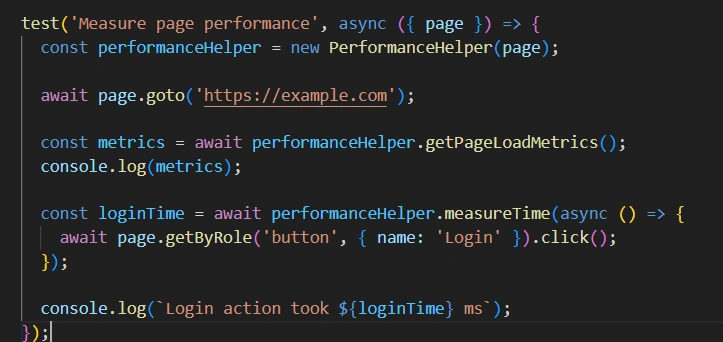
Sample Output
{
  pageLoadTime: 920,
  domContentLoaded: 610,
  responseTime: 180
}

Login action took 430 ms
Best Practices
Run tests in the same environment for consistent results.
Run the test multiple times and use the average value.
Set acceptable performance limits for your application.
Reuse performanceHelper.ts in different test cases.
Limitations
Playwright is not a load testing tool.
It cannot test many users at the same time.
Results may change based on the network or computer.
It mainly measures browser (frontend) performance.
Conclusion
Playwright is a great tool for checking basic website performance during UI automation. With a simple performanceHelper.ts, you can measure page load time and user actions to find performance issues early. For advanced performance or load testing, use Playwright together with tools like Lighthouse, k6, or JMeter.
Join the conversation! Your thoughts help the community grow.