

Introduction
Live Monitor is a monitoring and debugging feature in Microsoft Power Apps that helps developers observe app activity in real time. It provides visibility into events, network requests, data operations, errors, and performance-related information while the application is running.
It is particularly useful for identifying unnecessary SharePoint calls, slow operations, connector failures, delegation issues, and unexpected behavior in Power Apps.
Purpose
The main purpose of Live Monitor is to:
Monitor Power Apps activity in real time.
Track SharePoint and connector requests.
Identify failed or slow operations.
Analyze Power Apps formulas and actions.
Troubleshoot application errors.
Identify unnecessary API/SharePoint calls.
Validate performance improvements.
Understand the sequence of operations triggered by user actions.
How to Open Live Monitor
You can open Live Monitor directly from Power Apps Studio:
Open your Canvas App in Power Apps Studio.
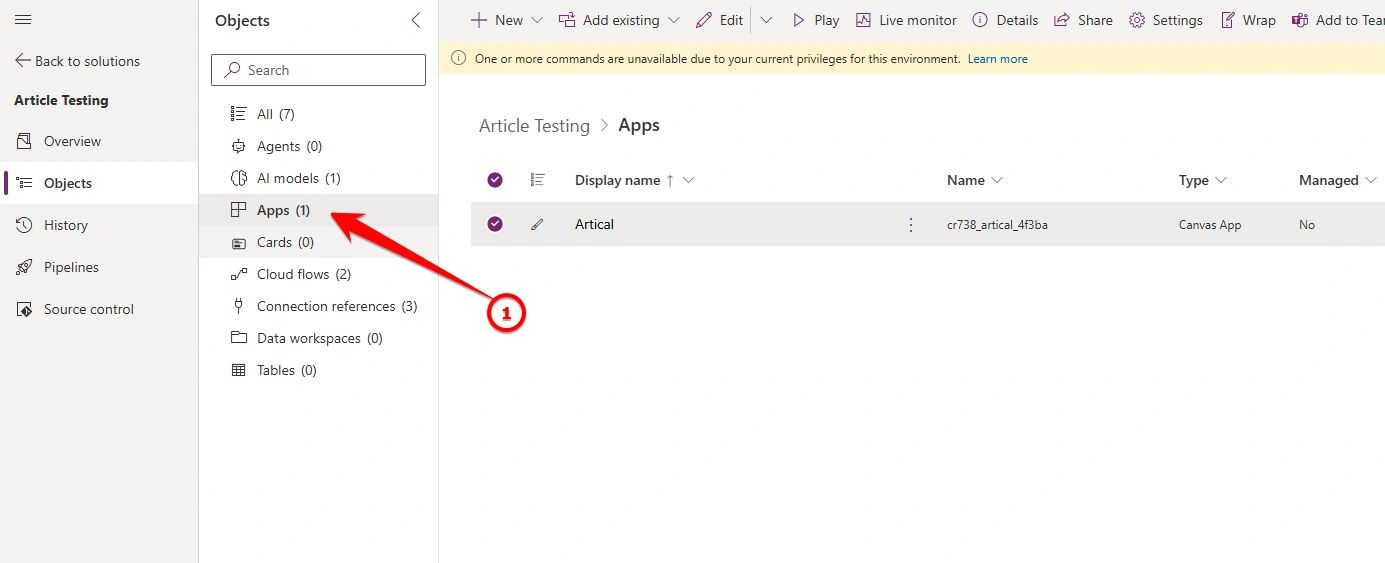
2.From the left navigation, select Advanced tools or open the Tools menu, depending on the current Power Apps Studio interface.
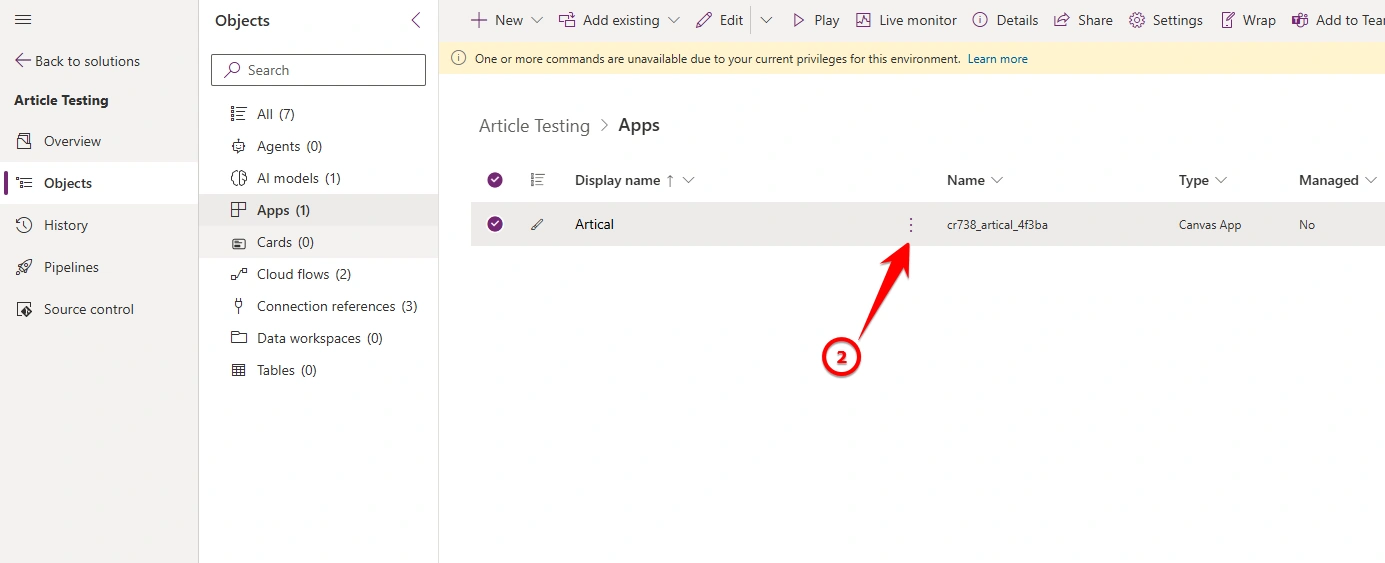
3.Select Live Monitor.
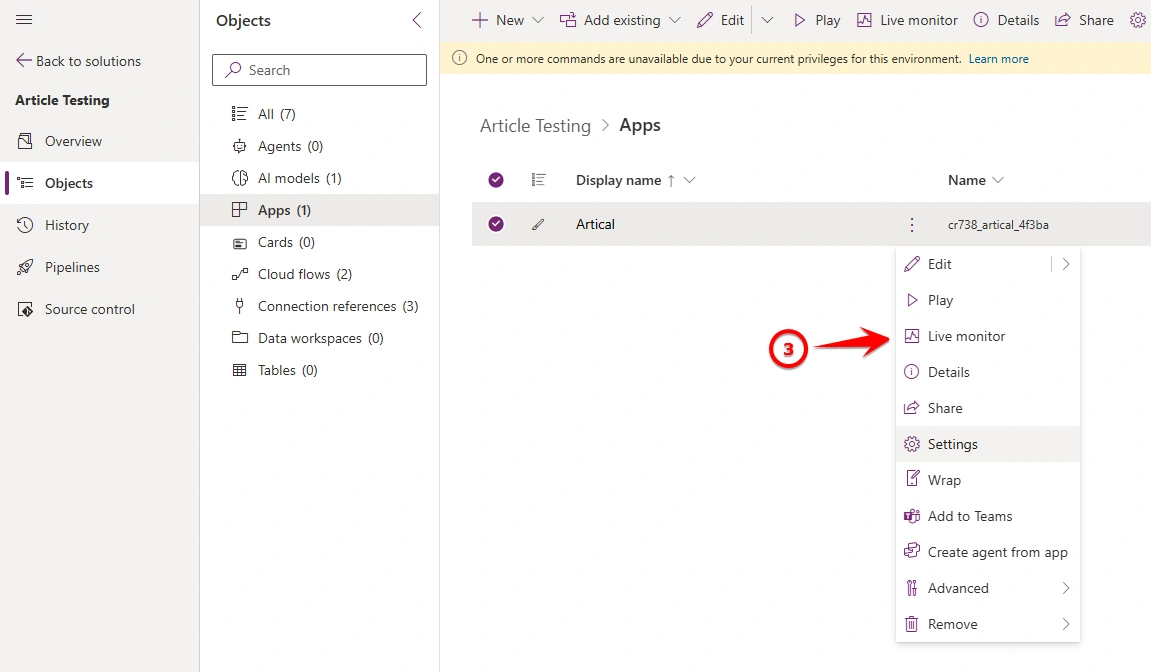
4.Live Monitor will open in a new tab or window.
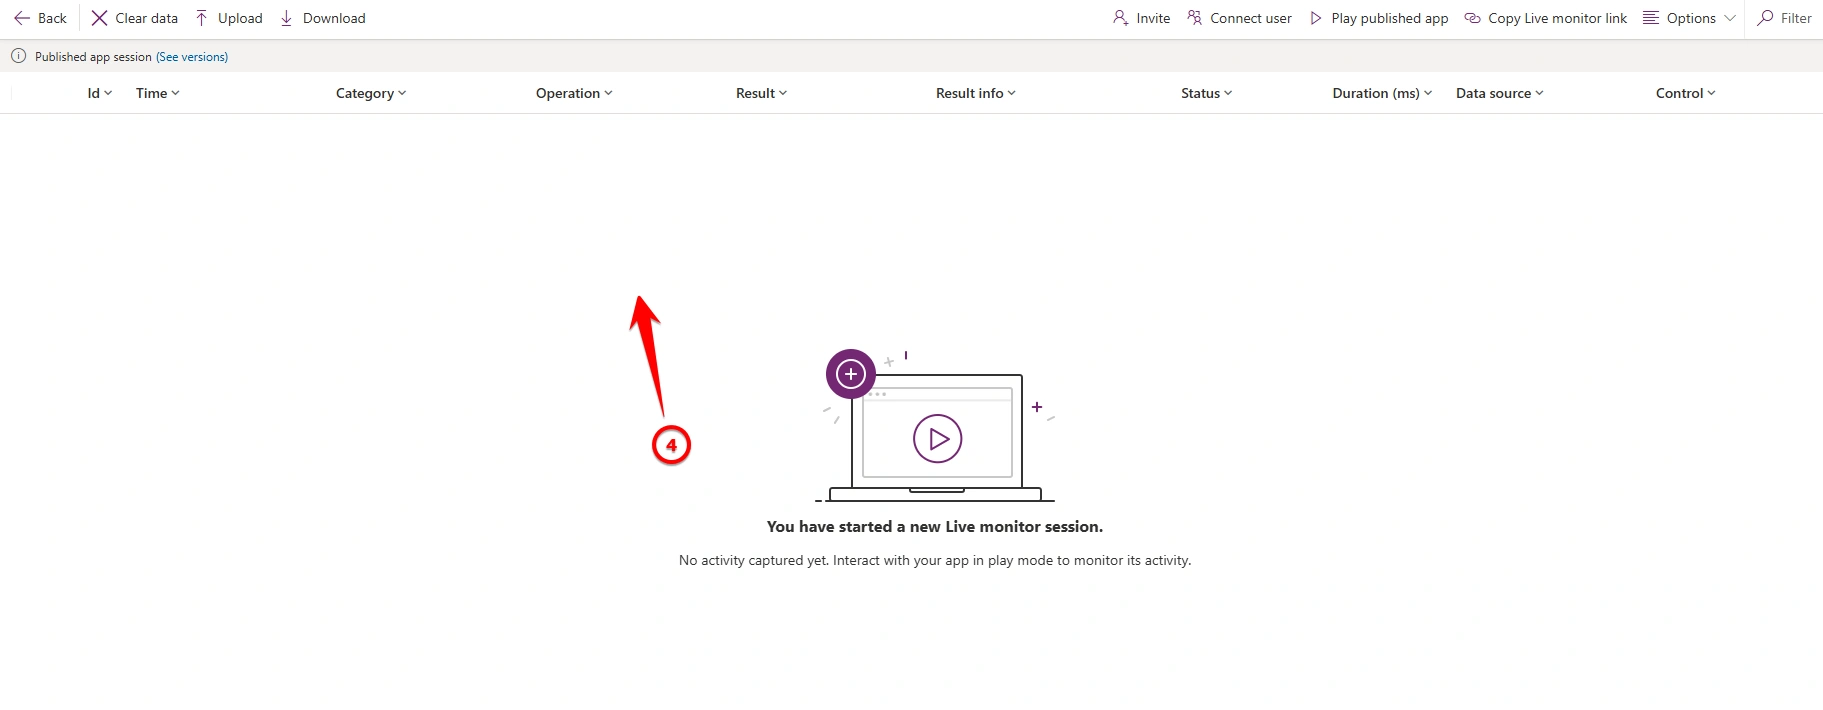
5.Select Play or run the app to start capturing events.
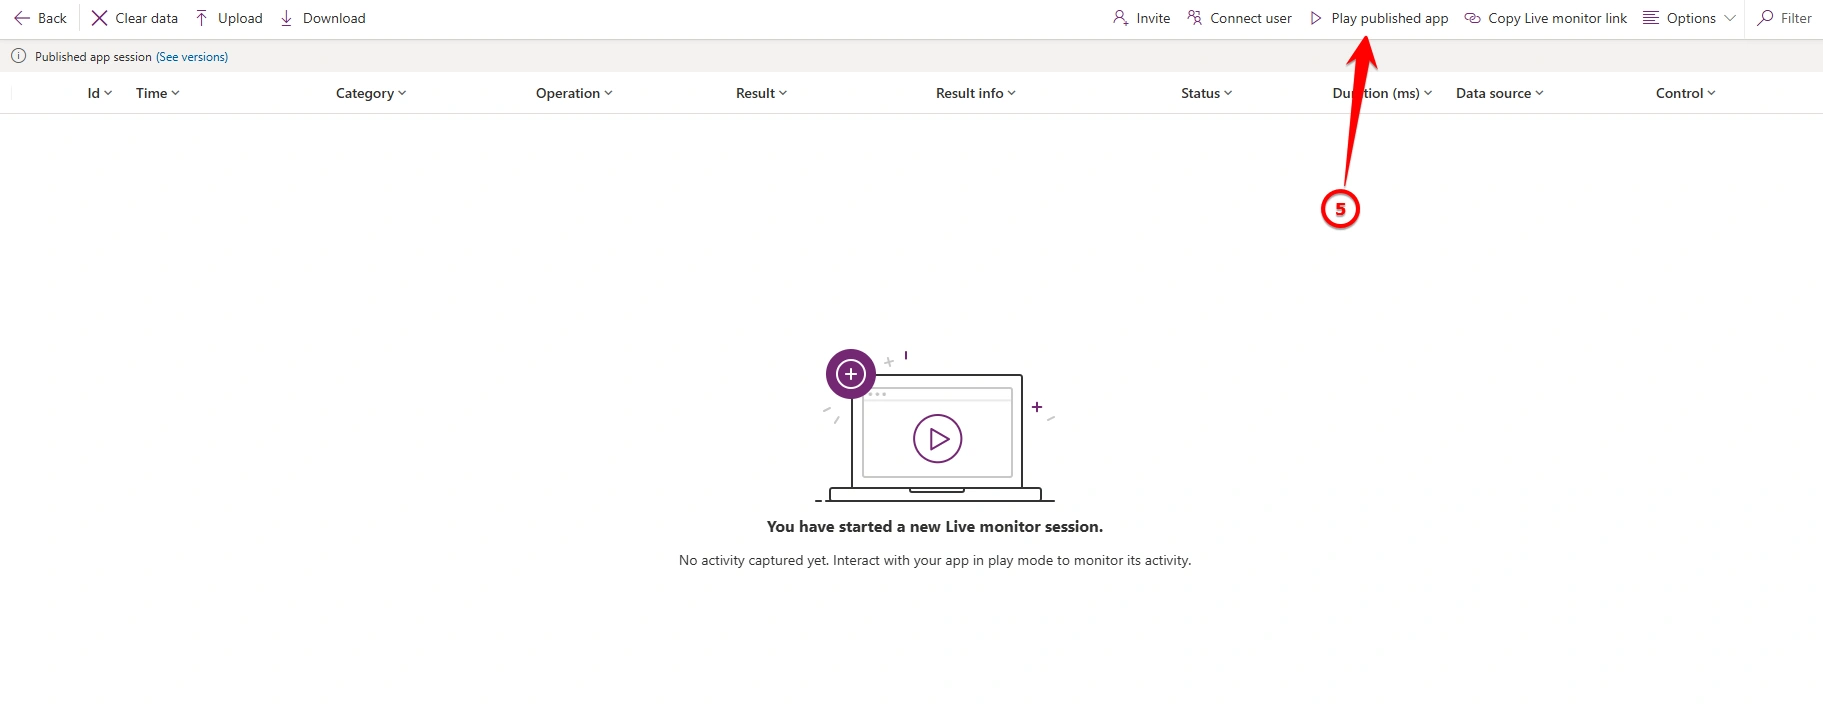
6.Perform the action you want to troubleshoot, such as Approve, Reject, Save, or Submit.
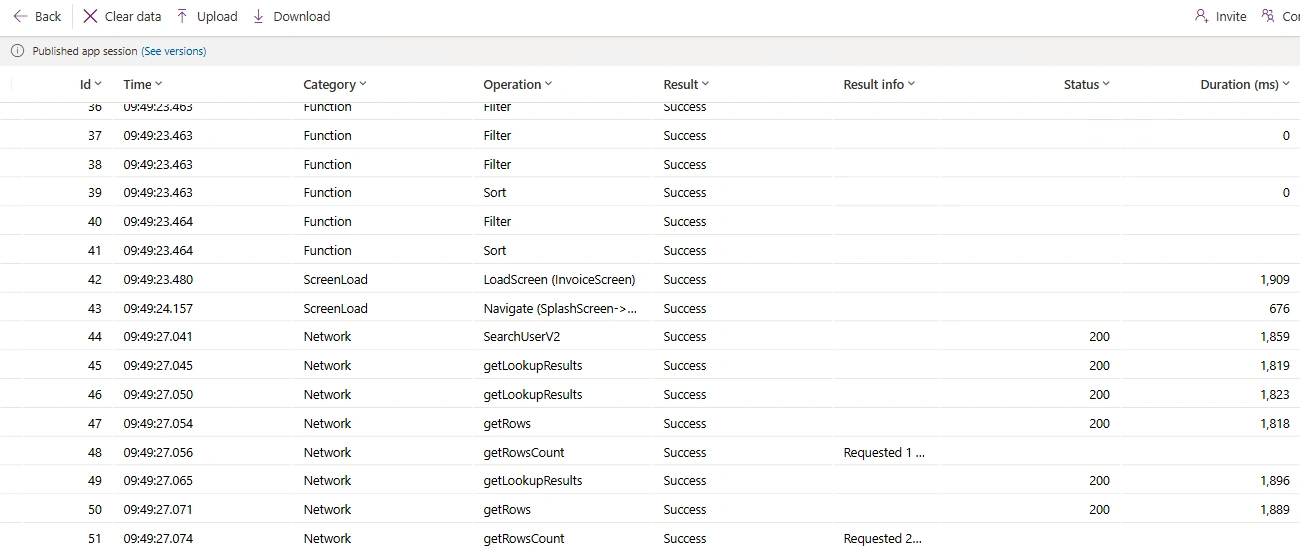
7.Review the events generated by the app, including SharePoint calls, Power Automate calls, errors, and performance information.
Monitoring Application Events
When an action is performed in the application, Live Monitor displays the associated events.
For example, when a user clicks an Approve button, Live Monitor can help identify:
Approve Button
      ↓
Power Apps Formula
      ↓
SharePoint Query
      ↓
SharePoint Update
      ↓
Power Automate Flow
      ↓
Response
      ↓
UI Update
This makes it easier to understand exactly what happens when a user performs an action.
SharePoint Call Monitoring
Live Monitor can be used to analyze SharePoint requests generated by Power Apps.
For example, an approval action may generate multiple SharePoint calls:
1. Get Invoice Details
2. Get GL Coding Details
3. Get Invoice Documents
4. Get Approver Levels
5. Update Invoice Details
This is useful when optimizing Power Apps because unnecessary calls can increase application load time and affect performance.
Example
If the Approve button generates five SharePoint calls, Live Monitor can be used to verify:
Which calls are executed.
Which calls are required.
Which calls are duplicated.
How long each request takes.
Whether any request fails.
Error Troubleshooting
Live Monitor can help identify errors occurring during application execution.
Common issues that can be investigated include:
SharePoint request failures.
Connector errors.
Invalid Power Apps formulas.
Missing records.
Permission issues.
Delegation-related behavior.
Power Automate flow failures.
Unexpected data returned from a connector.
For example:
User clicks Approve
        ↓
SharePoint Update
        ↓
Request Failed
        ↓
Live Monitor identifies failed request
        ↓
Check error details
        ↓
Correct formula / connector / permission
Performance Analysis
Live Monitor is also useful for application performance optimization.
During performance testing, developers can compare the number of connector calls before and after an optimization.
Before Optimization
Approve Button
   ├── SharePoint Call 1
   ├── SharePoint Call 2
   ├── SharePoint Call 3
   ├── SharePoint Call 4
   ├── SharePoint Call 5
   └── SharePoint Call 6
After Optimization
Approve Button
   ├── SharePoint Call 1
   ├── SharePoint Call 2
   └── SharePoint Call 3
This allows the development team to validate that unnecessary requests have been removed.
Live Monitor for Invoice Approval Application
For an Invoice Approval Power Apps application, Live Monitor can be particularly useful for monitoring the approval process.
For example:
Invoice Selected
      ↓
Load Invoice Details
      ↓
Load GL Coding Details
      ↓
Load Invoice Documents
      ↓
Load Approver Levels
      ↓
Validate Invoice
      ↓
Approve Invoice
      ↓
Update Task
      ↓
Update Invoice Status
      ↓
Trigger Power Automate
Live Monitor can be used to verify whether each operation is executed correctly and in the expected sequence.
Benefits
| Area | Benefit |
|---|---|
| Debugging | Quickly identify errors |
| Performance | Identify slow operations |
| SharePoint | Monitor connector calls |
| Power Automate | Validate flow execution triggers |
| Formula Analysis | Understand formula execution |
| Optimization | Remove unnecessary requests |
| Testing | Validate application behavior |
| Troubleshooting | Investigate unexpected results |
Best Practices
When using Live Monitor, follow these practices:
1. Test One Action at a Time
Perform one operation, such as Approve, Reject, Save, or Delete, and then analyze the generated events.
2. Check the Number of Data Calls
If a single button generates many SharePoint requests, investigate whether some calls can be eliminated.
3. Look for Repeated Queries
Repeated LookUp(), Filter(), or data-source operations can sometimes be optimized.
4. Monitor Power Automate Calls
Verify that flows are called only when required and that the correct parameters are passed.
5. Test with Realistic Data
Performance can change significantly when the application contains a large number of SharePoint records.
6. Use Live Monitor Before and After Optimization
Compare the number of calls and execution time before and after making changes.
Conclusion
Live Monitor is an important Power Apps development and troubleshooting tool. It provides real-time visibility into application activity and helps developers understand how formulas, connectors, SharePoint requests, and other operations are executed.
For an Invoice Approval application, it can be especially valuable for analyzing Approve button execution, SharePoint calls, approval-level processing, Power Automate triggers, and overall application performance.
Join the conversation! Your thoughts help the community grow.