

Introduction
In this article, we explore the Visual Studio Code is a free code editor developed by Microsoft for Windows, Linux, and macOS. We create the C# Console application in Vs code with the help of .NET Core.
Visual Studio Code (Vs Code) is optimized for cross-platform .NET Core development. Visual Studio Code is a lightweight but powerful source code editor which runs on your desktop and is available for Windows, macOS, and Linux.
Use Visual Studio Code with the C# extension to get a powerful editing experience with full support for C# IntelliSense and debugging.
Prerequisites
- Install Visual Studio Code.
- Install the .NET Core SDK.
Objective
Let's get started with a simple "Console demo application" program on .NET Core,
Create Console Application
Follow the below steps to create the console application,
Steps
- Open a project -> Open Visual Studio Code.
- Open the Integrated Terminal from Visual Studio Code selecting
- Terminal > New Terminal from the sub menu.
- The dotnet command creates a new application of type console for you. The -o parameter creates a directory named ConsoleApplicationDemo where your app is stored and populates it with the required files. The cd ConsoleApllicationDemo command puts you into the newly created app directory.
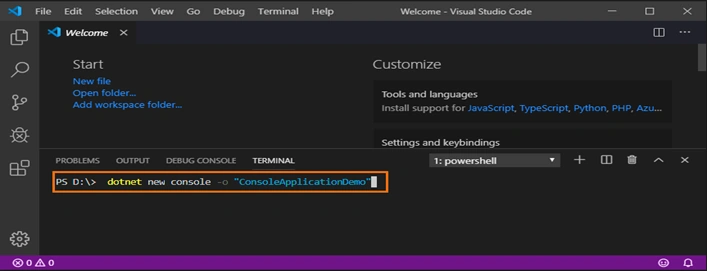
- Switch the path to the folder ConsoleApplicationdemo using the below command.
- D:\> cd ConsoleApplicationdemo
- Enter the below command to open the ConsoleApplication project in VS Code
- D:\ConsoleApplicationdemo> code.
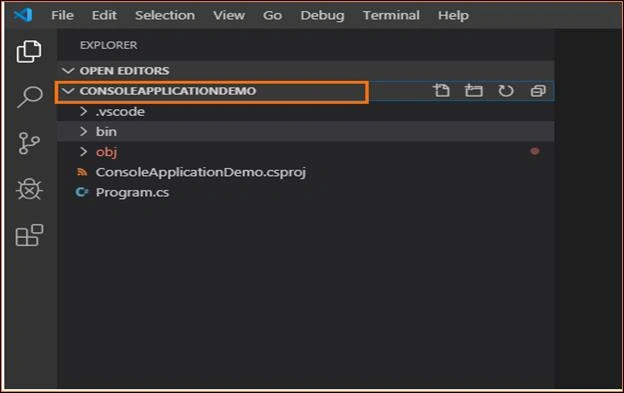
- Repeated Step 3 for opening the terminal command prompt.
- Run dotnet restore command to resolve the dependencies of the project and give you access to the required .NET Core packages that are needed to build your project
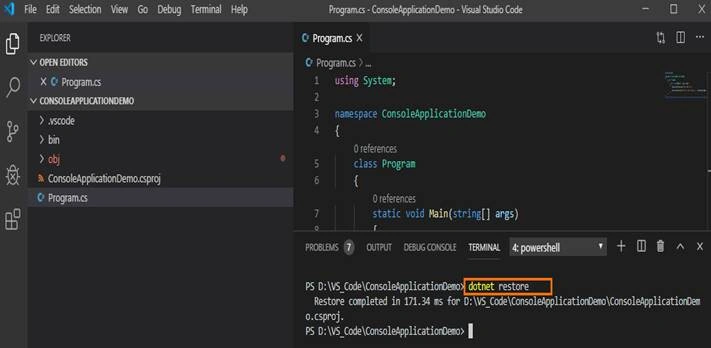
- Type the following command: dotnet run. Run the console application and the below screen output appears.
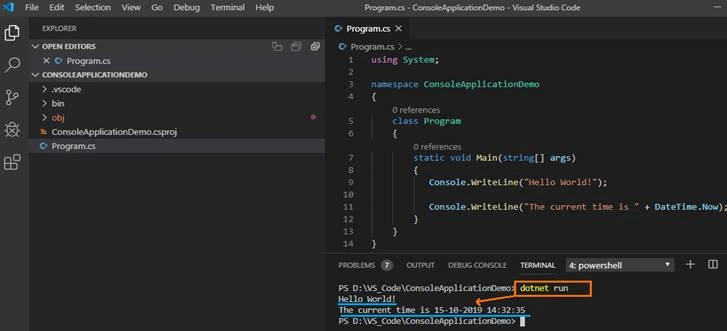
Debugging
One of the key features of VS Code is its great debugging support. VS Code's built-in debugger helps accelerate your edit, compile and debug loop.
Follow the below steps for the C# debugger,
Steps
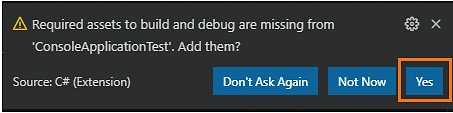
- The first time you open a C# Program.cs file in Visual Studio Code the below pop window appears
- Visual Studio Code should prompt you to add the missing assets to build and debug your app. Select Yes.
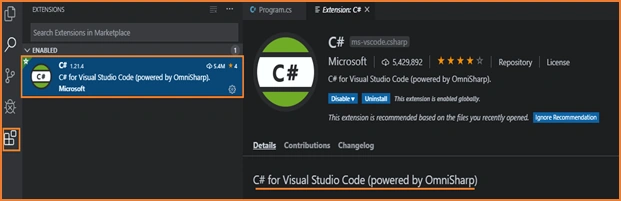
- Start the install OmniSharp loads in the editor.
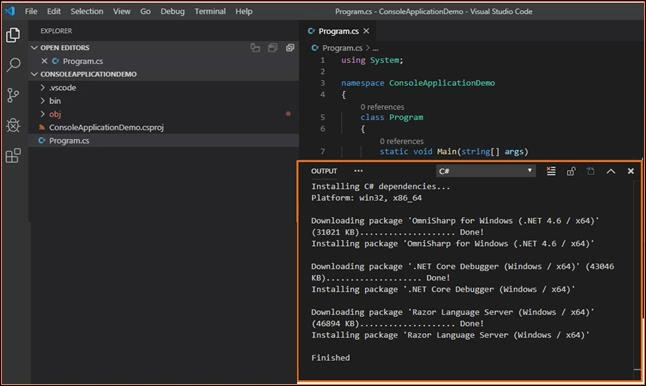
- After completion the below message shows in the command window
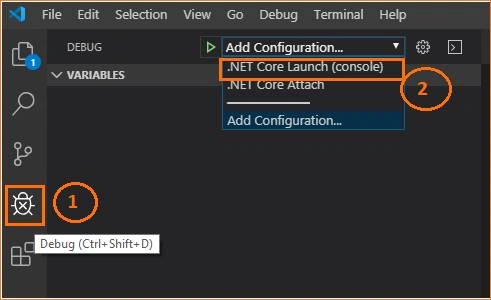
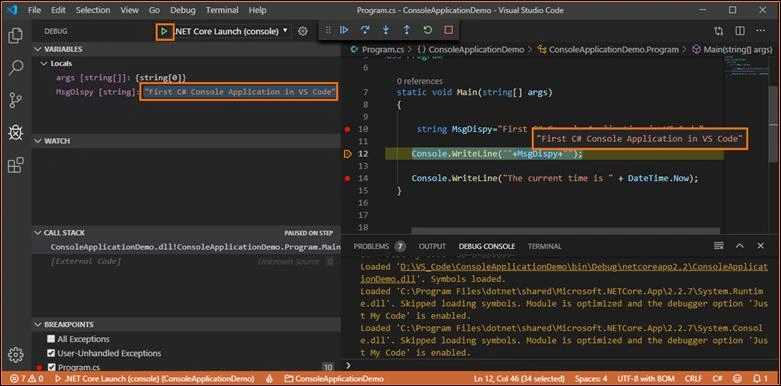
- VS Code left Navigation -- click on Debugger Icon
- Locate the
 green arrow at the top of the pane. Make sure the drop-down next to it has .NET Core
  Launch (console) selected.
- Add a breakpoint to your project by clicking on the editor margin
- To start debugging, press F5 or select the green arrow

- Show the local variable value in the top left pane.
Top Extensions
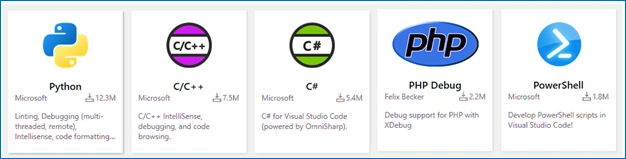
In the VS code there are more debugging extensions for debugging other languages and runtimes (including PHP, C#, Python, C++, PowerShell and many others), look for Debuggers extensions in our VS Code Marketplace or select Install Additional Debuggers in the top-level Debug menu.
Fco Javier Rodriguez GomezPosted Apr 30, 2020, 9:42 AM
Great! Thank you so much
Prasham SabadraPosted Oct 16, 2019, 4:23 PM
Nice article Sagar, thanks for sharing.