

In this example I will implement a Chart Control in a Windows application.
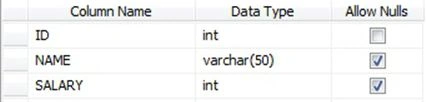
Step 2 : Now, create a new Windows Forms Application.
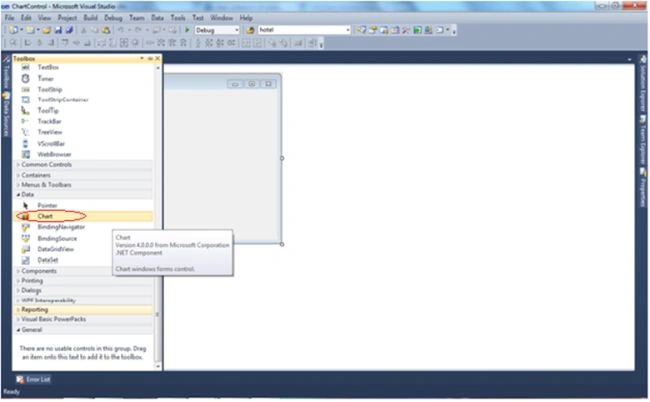
Step 3 : Drag and drop the Chart Control to the form as shown in the screen below.
Step 4 : Add the following code to the form.
Namespace
using System.Data.SqlClient;
using System.Web.UI.DataVisualization.Charting;
Code On Form Load Event
SqlConnection conn = new SqlConnection("Server=LENOVO-PC;Database=Abhinav;User Id=sa;Password=****");
string qry = "select Name, Salary from employee";
SqlDataAdapter da = new SqlDataAdapter(qry, conn);
DataSet ds = new DataSet();
da.Fill(ds,"Salary");
chart1.DataSource = ds.Tables["Salary"];
chart1.Series["Series1"].XValueMember = "NAME";
chart1.Series["Series1"].YValueMembers = "SALARY";
this.chart1.Titles.Add("EMPLOYEE SALARY"); // Set the chart title
chart1.Series["Series1"].ChartType = SeriesChartType.Pie; // Set chart type like Bar chart, Pie chart
chart1.Series["Series1"].IsValueShownAsLabel = true; // To show chart value
On Button Click to Save Chart
this.chart1.SaveImage("D:\\chart1.Jpeg", ChartImageFormat.Jpeg);
MessageBox.Show("Chart Saved Successfully", Application.ProductName,
MessageBoxButtons.OK, MessageBoxIcon.Information);
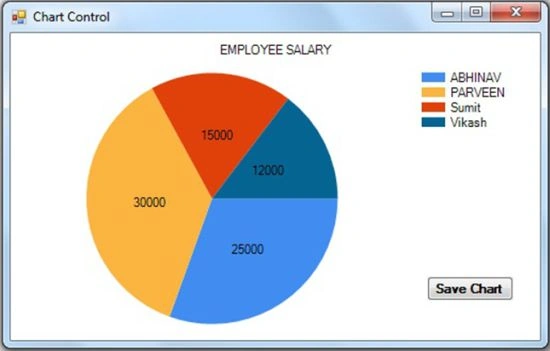
Step 5 : Now run the application, you will see a graphical report like this.
You can download the complete attached source code.
I hope you liked it.
Ratan SinghPosted Dec 6, 2019, 10:03 PM
Loved it …. thank you very much .. would like to know more about how to beautify the chart
Sandeep SalunkePosted May 24, 2016, 4:18 AM
Thank you, it useful but shows again and again
CHAITANYA KIRAN KASANIPosted Dec 28, 2014, 12:25 PM
how to show the mschart in crystal report ?
Chathuranga AbeyrathnePosted Nov 26, 2014, 12:08 AM
thanks but case is it shows again and again on the same chart when i click show Chart button
IsraelPosted May 3, 2014, 12:32 AM
Very nice