

Introduction

This article explores how to enhance PowerApps with interactive features. Learn to synchronize column chart selections to filter galleries seamlessly for a more dynamic user experience.
Steps
1. Setup
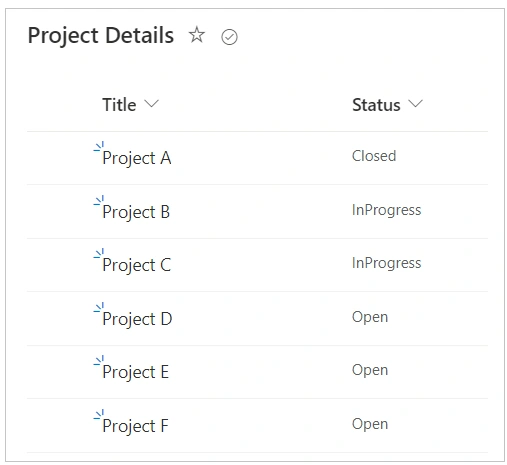
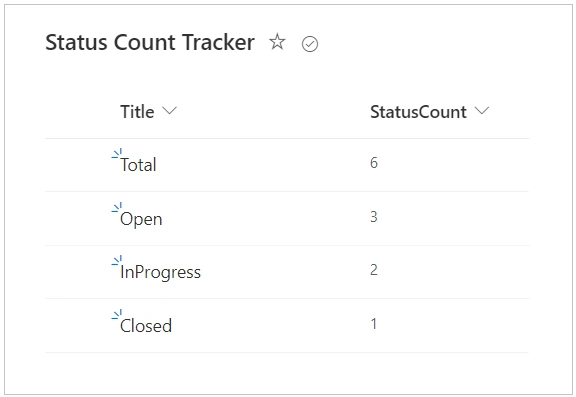
Assume that we have a "Project Details" list as the main list and a "Status Count Tracker" list tracking the count of the status with each project in SharePoint.
2. Prepare PowerApps
Add a new screen in PowerApps. Add the below code to the “OnVisible” property of the screen.
Clear(colStatusData);
ForAll(
    'Status Count Tracker',
    Collect(
        colStatusData,
        {
            Title: Title,
            StatusCount: StatusCount
        }
    )
);
Set(
    varSelectedStatusTitle,
    "Total"
)
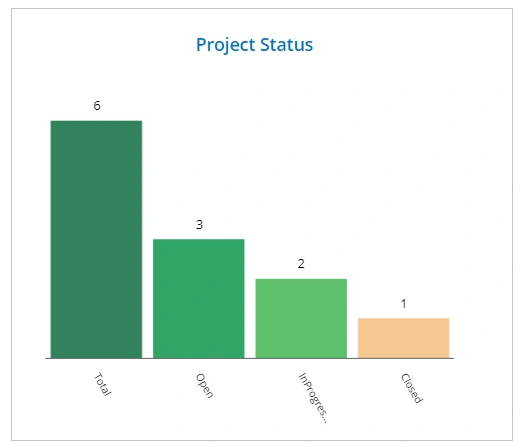
- Insert the Column Chart into the screen.
- Adjust the width of the chart as needed.
- Remove the legend from the chart.
- Set the “Items gap” property to “12”.
- Set the “Items” property of the Column Chart as colStatusData.
3. Enhance X Axis Labels
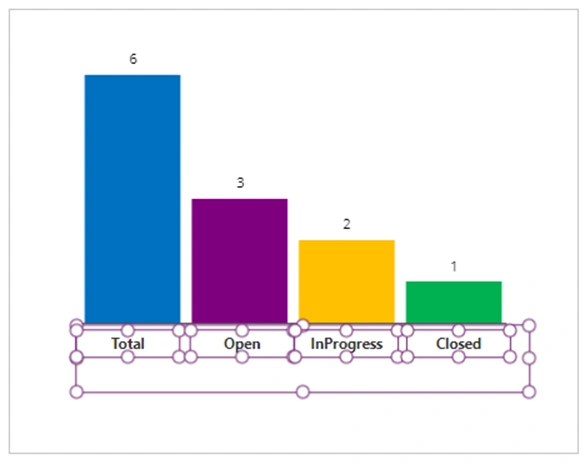
- Add a label named “lblTohidetheXLabel”.
- Add four more labels to display the X-axis labels.
- Adjust or set “ItemColorSet” as [ RGBA(0, 112, 192, 1), RGBA(128, 0, 128, 1), RGBA(255, 192, 0, 1), RGBA(0, 176, 80, 1)].
4. Implement Column Chart Selection
Add the following code to the “OnSelect” property of ColumnChart:
Set(
    varSelectedStatusTitle,
    LookUp(
        'Status Count Tracker',
        StatusCount = ColumnChart.Selected.StatusCount && Title = ColumnChart.Selected.Title
    ).Title
);
5. Create Filtered Gallery
- Add a blank vertical gallery.
- Add two labels inside the gallery.
- Set the "Items" property of the gallery as follows:
If(
    varSelectedStatusTitle = "Total",
    'Project Details',
    varSelectedStatusTitle = "Open",
    SortByColumns(Filter('Project Details', Status = "Open"), "Created", SortOrder.Descending),
    varSelectedStatusTitle = "InProgress",
    SortByColumns(Filter('Project Details', Status = "InProgress"), "Created", SortOrder.Descending),
    varSelectedStatusTitle = "Closed",
    SortByColumns(Filter('Project Details', Status = "Closed"), "Created", SortOrder.Descending)
)
6. Inside Configure Gallery Labels
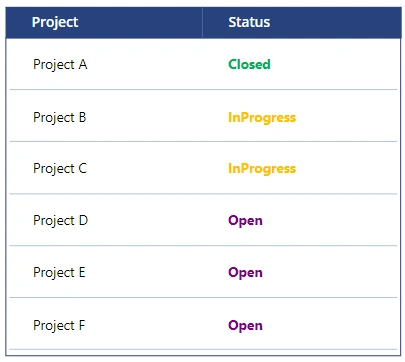
- Inside the gallery, set the “Text” property of the first label as ThisItem.Title and the second label as ThisItem.Status.
- Add two labels for the header of that gallery and set the Text property as “Project” and “Status” respectively.
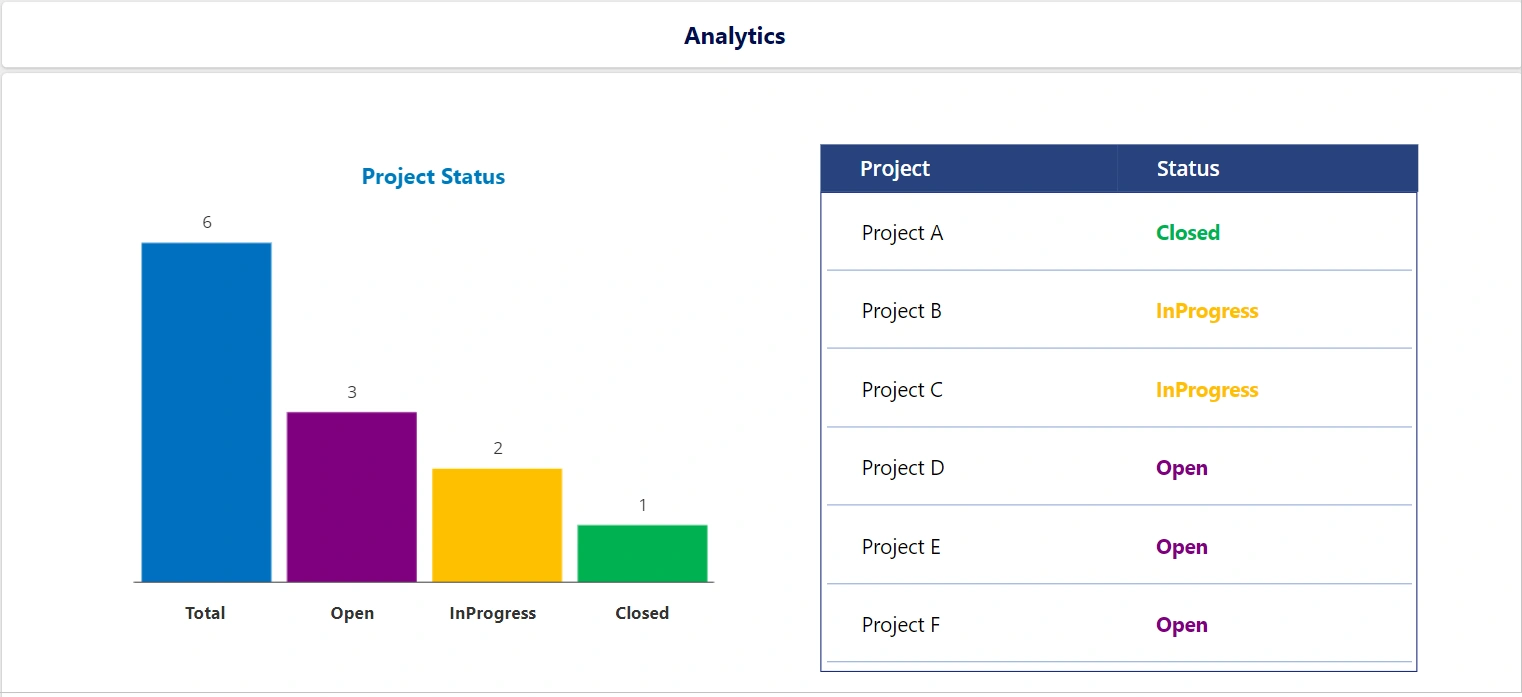
By following these steps, you can effectively synchronize column chart selections with filter galleries in PowerApps, offering users a more interactive and dynamic experience.
Enjoy Learning!
Join the conversation! Your thoughts help the community grow.