

Introduction
Debugging is a feature of Visual Studio by which we can see the program code step-by-step. It allows the developers to watch how the code works in a step-by-step manner, how the values of the variables change, how the objects are created and destroyed. We can apply the debugging to programs using Breakpoints in the project's code files by specifying the element code <compilation debug="true"> in the application config file. Visual Studio has a debug toolbar that provides all the tools available for debugging.
Diagnostic information could include the amount of time needed to execute a critical method, the number of transactions committed per second, or the number of users currently with active sessions. To facilitate the recording of diagnostic information, we have some software tools like: log4net. WCF diagnostics provide End-To-End tracing that provides instrumentation data for troubleshooting an application without using a debugger.
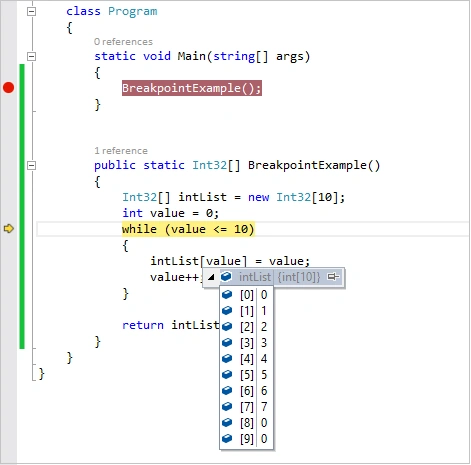
Microsoft announced some improvements in Debugging and Diagnostics features of Visual Studio 2015, at the day of Visual Studio Connect() from New York, USA on November 12, 2014. In Visual Studio 2015 Preview we will get the following improvements:
- Debugging with Lambda expressions.
- Debugging with LINQ Query
- Breakpoints configurations.
- Debugging support for cross-platform.
- C++ debugging enhancements.
Debugging with Lambda expression
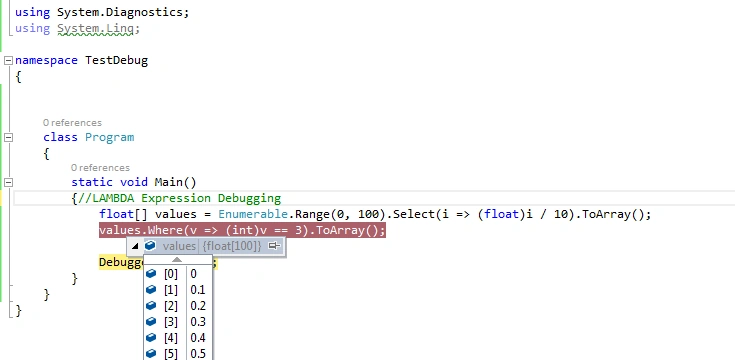
Now we can debug the code expression written in LINQ or Lambda with Visual Studio 2015 Preview. Prior to this version, .NET Framework (v4.6), debugging of a lambda or LINQ was not possible. So, let's learn how to debug LINQ expressions of as well Lambda expressions. When using a LINQ or Lambda, the debugger will quickly discover the dreaded message “Expression cannot contain lambda expressions”. Let's see that in an example.
Example
- Dynamic variable can not be evaluated.
- Support for evaluation of COM objects is limited.
- ASP.NET 5 with 64-bit IIS and remote debugging ASP.NET 5 is not supported.
- Declaring variables in the Immediate window isn't supported
- Evaluation inside async and iterator methods is unreliable
Debugging with LINQ Query
In Visual Studio 2015, we can debug the Language Integrated Query (LINQ) Query. It works with LINQ statements, including stepping, setting breakpoints and viewing the result in a debugger window. A LINQ query is not evaluated until it is created or declared just before the writing query. Therefore, the query doesn't have a value until it is evaluated.
- Function MyFunction(ByVal x As Char)
- Return True
- End Function
- Sub Main()
- 'Query creation
- Dim x = From it In "MyCollection"
- Where MyFunction(it)
- Select New With {.a = it}
- ' Query execution
- For Each cur In x
- Console.WriteLine(cur.ToString())
- Next
- End Sub
Limitations: It has some limitations, as given below:
- Edit and continue not supported in LINQ: Edit and Continue isn't supported to change LINQ queries. If we edit a LINQ query during debugging, a dialog box appears that tells us the changes are not supported by the edit and continue command. So in this situation, we must stop the debugging to edit the query and execute it again for debugging.
Breakpoints Configurations
Visual Studio 2015 provides a new breakpoints configuration windows that makes it easy to customize breakpoint behavior by specifying conditions and actions. where "Conditions" specify boolean properties that must be true for the debugger to break at a selected line. Conditions may have the following properties:
- Conditional Statements: It indicates that break only when our specified condition is met.
- Hit Counts: Hit count indicates to break only after the breakpoint has been hit a certain number of times.
- Filters: Where Filter says indicates to break when the breakpoint is hit on a specific thread or process. It is useful for debugging code running in parallel.
Debugging support for cross-platform
With Visual Studio 2015, we can create and debug native mobile apps that can run on Windows, Android and iOS devices. We can use the Microsoft Emulator for Android apps, or use own device (mobile.tab) and for debugging our code directly. We can use the following to develop the application for cross-platform.
- Visual C++/Android: We can use the Visual C++ for Cross-Platform Mobile Apps Development along with third-party tools like the Android NDK to create native apps for Windows and Android also. Where NDK is a toolset that allows us to implement parts of our app using native-code languages such as C and C++. But most apps don't need the Android NDK.
- Visual C#/ Xamarin: We can use Xamarin to develop native apps for Windows, iOS and Android in Visual Studio using C#. Here C# is the best language for mobile development. With Xamarin, we can write our app code entirely in C# and can share the code on iOS, Android, Windows, MAC also.
- JavaScript / Cordova: We can use the Visual Studio 2015 for Apache Cordova to build native apps for Windows, iOS and Android with JavaScript.
C++ debugging enhancements
Microsoft enhanced the debugging features of C++ in Visual Studio 2015. The following are the two major enhancements in it.
- Improved startup performance on F5: When a C++ debugger launches a process, the Windows debug heap is disabled and the normal heap is used. That's why it results in a faster start for debugging.
- Deadlock Possibility Reduced: In Visual Studio 2015 the possibility of deadlock is reduced. If the C++ debugger is stopped at a breakpoint and our app requires a lock then at that time the C++ debugger will slip execution of the threads of the app to evaluate an expression in the Immediate window.
Summary
In this article we saw the enhancements of Debugging and Diagnostics in Visual Studio 2015 with details. In a future article we will explore it more.
Vipul MalhotraPosted Jul 6, 2015, 4:42 AM
thanks for writing
Abhishek TripathiPosted Dec 30, 2014, 1:45 AM
If u can give an article on java script debugging, it would be very helpful
Manish Kumar ChoudharyPosted Nov 22, 2014, 3:11 AM
very helpful feature.
Vithal WadjePosted Nov 21, 2014, 3:16 PM
good feature,Thanks for sharing