

Introduction
Azure Application Insights emerges as a powerful tool for collecting and analyzing telemetry data from various applications and services hosted on Azure or elsewhere. By integrating Dataverse plugins with Azure Application Insights, developers can gain deep visibility into plugin executions, identify performance bottlenecks, detect errors, and derive actionable insights to enhance the overall quality of plugin solutions.
Set up insights
The first step in configuring the integration is to create an Azure Application Insights resource. It is very easy to do this:
- Log in the Azure portal.
- Create a new resource.
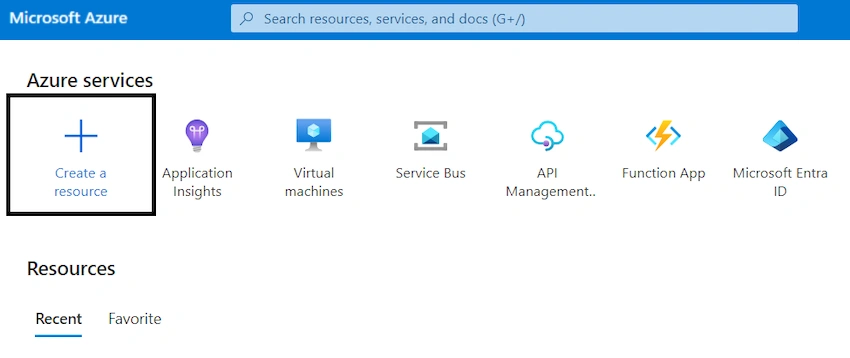
- Search for Application Insights and click Create.
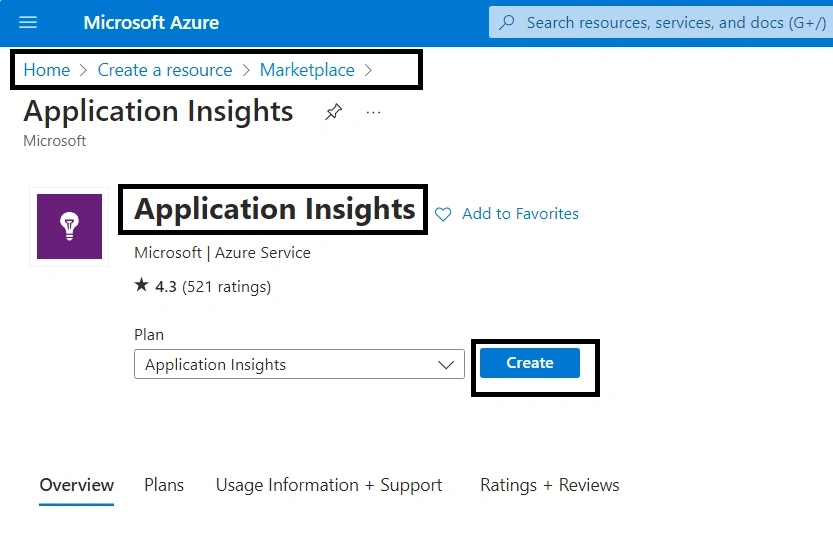
- Fill the fields and create the new resource.
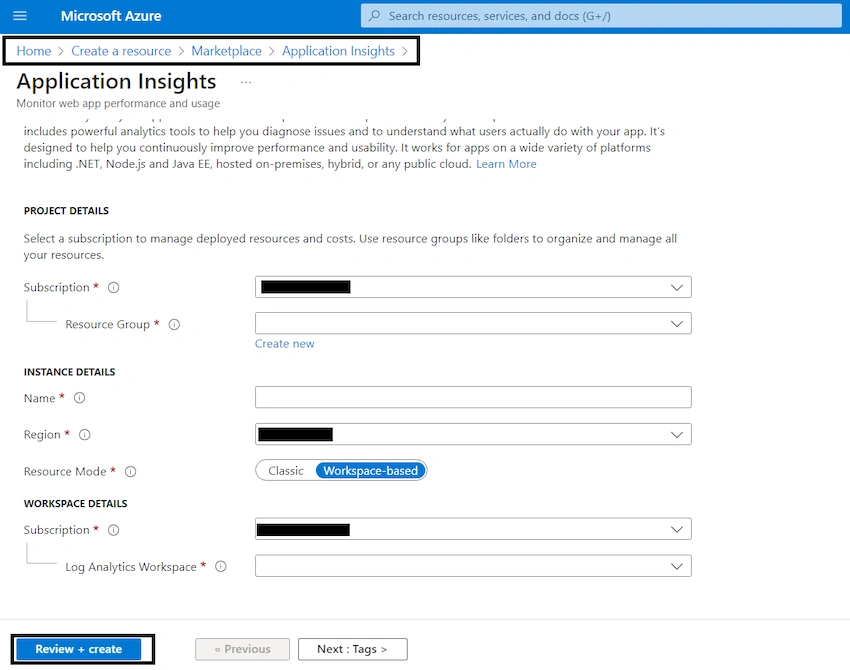
- Please take note that to use this resource, you must have at least one of the following rights: admin, writer, or contributor.
Set up insights to Power Platform admin center
You must visit the Power Platform admin center after the Azure resource has been created:
- On the right panel, select Analytics > Data export
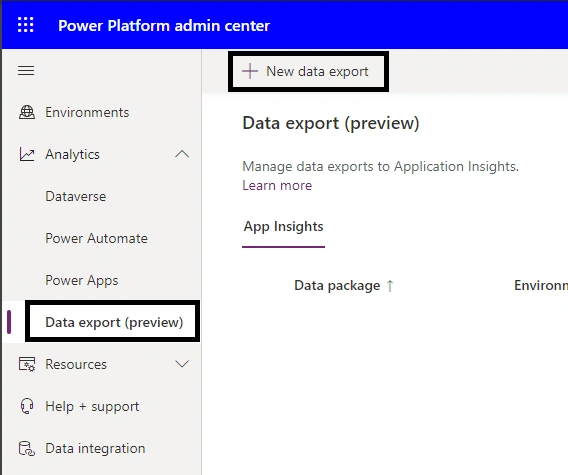
- Choose the appropriate environment by clicking the "New data export" button.
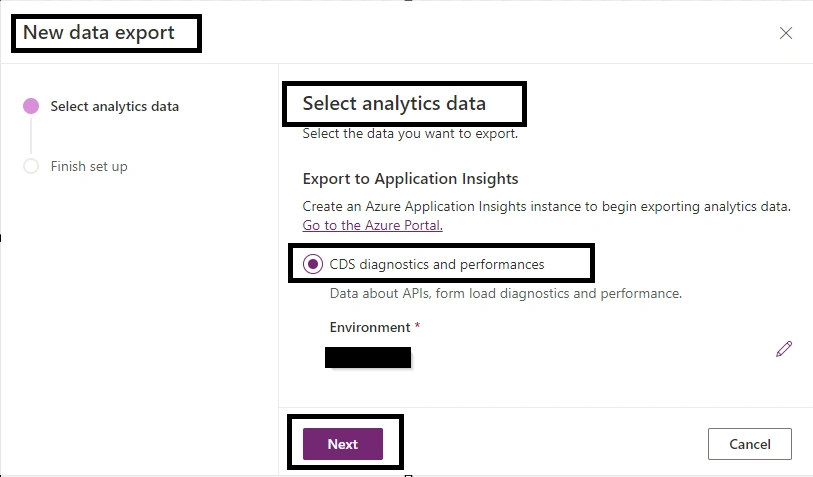
- Click on Next.
- Choose the recently created Application Insights resource.
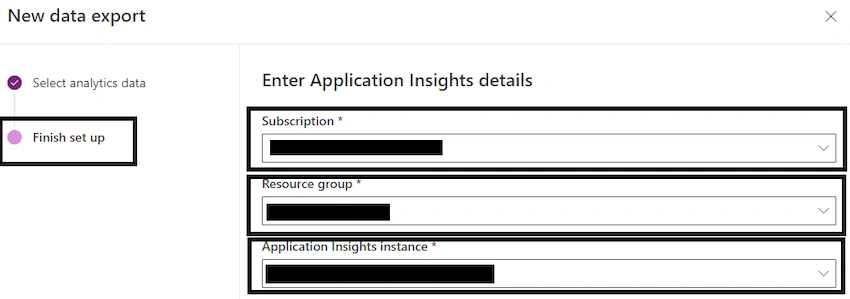
- Click on Create.
Telemetry with Application Insights
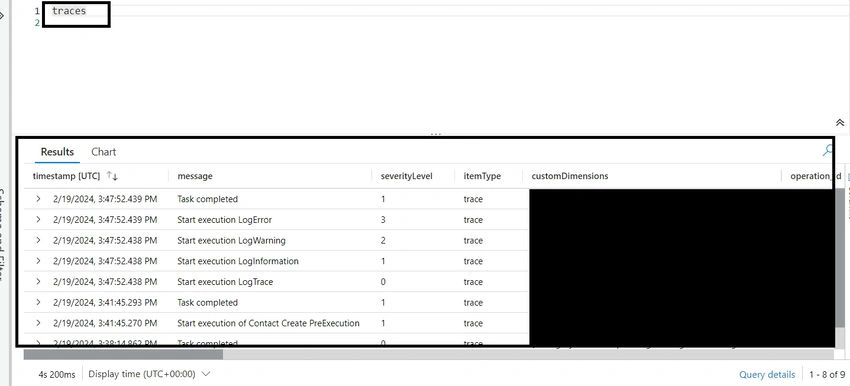
This new integration eliminates the need for additional coding by making all logs a developer writes from the Organization Service SDK within the ILogger interface accessible in the Application Insights resources! There may be a slight delay before the telemetry is visible in Azure because Dataverse will be receiving the logs and forwarding them to the Application Insight resource.
below id the plug-in code that makes usage of the ILogger interface
using System;
using System.IdentityModel.Metadata;
using IMSShared.ExtensionClasses;
using Microsoft.Xrm.Sdk;
using Microsoft.Xrm.Sdk.PluginTelemetry;

namespace Sample.Plugins.Telemetry
{
    public class ManageContact:IPlugin
    {
        public void Execute(IServiceProvider serviceProvider)
        {
            ITracingService tracer = (ITracingService)serviceProvider.GetService(typeof(ITracingService));
            IPluginExecutionContext context = (IPluginExecutionContext)serviceProvider.GetService(typeof(IPluginExecutionContext));
            IOrganizationServiceFactory factory = (IOrganizationServiceFactory)serviceProvider.GetService(typeof(IOrganizationServiceFactory));
            IOrganizationService service = factory.CreateOrganizationService(null);
            ILogger logger = (ILogger)serviceProvider.GetService(typeof(ILogger));
            try
            {
                logger.LogInformation("Start execution of Contact Create PreExecution");
                if (context.MessageName == "Create" && context.StageType() == ExecutionContextExtensions.StageTypeValues.PreExecution)
                {
                    Entity contactTarget = (Entity)context.InputParameters["Target"];
                    if (contactTarget.LogicalName != "contact")
                    {
                        logger.LogWarning("Plug-in registered for wrong entity {0}", contactTarget.LogicalName);
                        return;
                    }
                    contactTarget.Attributes.Add("Sample_externalid", Guid.NewGuid().ToString());
                    logger.LogInformation("Task completed");
                }
            }
            catch(Exception ex)
            {
                logger.LogError(ex, "Plugin failed");
            }
        }
    }
}
Application Insights Logs
Upon registration and activation of the plug-in, you can access the Application Insights Logs console. You can access the Application Insights resource on portal.azure.com.
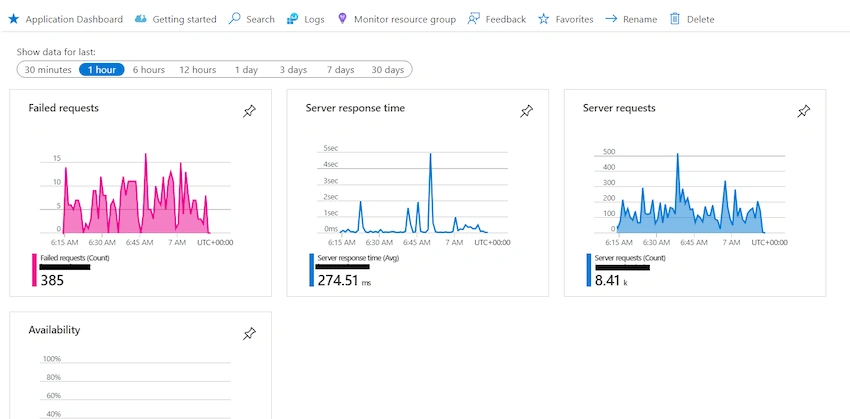
Next, select the Logs button located under the Monitoring section on the right panel to view the telemetry.
Conclusion
Developers can monitor, analyze, and optimize plugin behavior with a comprehensive telemetry solution when they integrate Azure Application Insights with Dataverse plugins. Developers can maximize the value provided to users and stakeholders in Microsoft Dataverse ecosystems by proactively addressing performance issues, enhancing reliability, and continuously improving the quality of plugin solutions by utilizing telemetry data.
16K20Posted May 12, 2025, 6:09 PM
Actually, it is much better to integrate with App Insights directly from plugin read my article to find out how https://dev.to/stas_sultanov/tracking-telemetry-in-power-platform-plugins-2i95