
Introduction
- Python 3.5 must be installed.
- Pip3 must be installed:
Go to command prompt → Type Command → pip3 install --upgrade pip
- Install pandas
Go to command prompt → Type Command → pip install pandas
- Install Jupyter notebook(It will help you to write and execute python and pandas codes by connecting to the terminal):
Go to command prompt → Type Command → pip3 install jupyter
- Open Jupyter notebook:
Go to command prompt → Type Command → jupyter notebook
- It will open Jupyter notebook into a browser like below :

Here, open one new Python project. You need to import Pandas here. So, import the below library:
import pandas as pd
Series
Prepare Data
Series is a special method of the Pandas library. It is like an array, list, or column in a table and creates one-dimensional objects. Below is an example of the code:
- purchase_1 = pd.Series({
- 'Name': 'Chris',
- 'Item Purchased': 'Pencil',
- 'Cost': 22.50
- })
- purchase_2 = pd.Series({
- 'Name': 'Ram',
- 'Item Purchased': 'Book',
- 'Cost': 220.50
- })
- purchase_3 = pd.Series({
- 'Name': 'Mohan',
- 'Item Purchased': 'Pen',
- 'Cost': 22.50
- })
- purchase_4 = pd.Series({
- 'Name': 'Gulam',
- 'Item Purchased': 'Diary',
- 'Cost': 22.50
- })
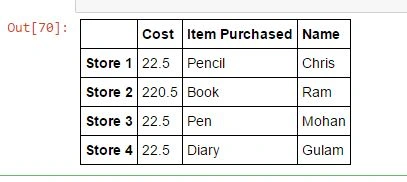
- df = pd.DataFrame([purchase_1, purchase_2, purchase_3, purchase_4], index = ['Store 1', 'Store 2', 'Store 3', 'Store 4'])
- df.head()
- df.loc['Store 1']
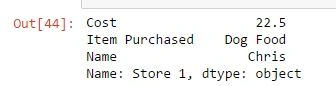
- Get all data
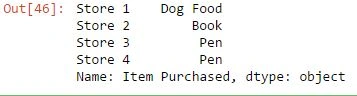
- for "Item Purchased":
- df['Item Purchased']
- Get the cost of Store 1:
- df.loc['Store 1', 'Cost']
- df.T
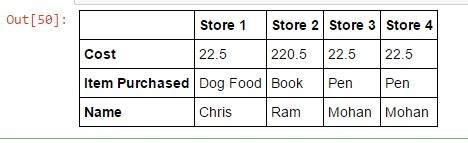
- Get cost data
- for all stores:
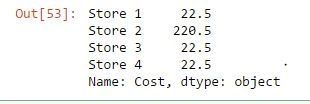
- df.T.loc['Cost']
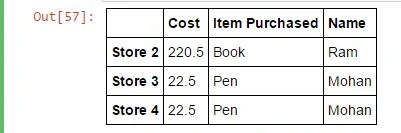
- df.drop('Store 1')
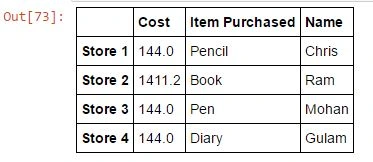
- df['Cost'] *= 0.8
- df
Join the conversation! Your thoughts help the community grow.