

In this article, I will be explaining how to integrate chart.js with your Asp.Net Core application with 4 different types of charts, which are:
- Pie
- Bar
- Line
- Stacked Bar
Creation and usage of the Pie, Bar and Line Charts are very similar but the stacked chart is a bit more complex. Basically, a chart is a key-value list grouped in an animated way making it easier to understand and see the numbers, except for the stacked chart which has two keys and a value. A more detailed explanation will be placed with each example.
What is chart.js?
"Simple, clean and engaging HTML5 based JavaScript charts. Chart.js is an easy way to include animated, interactive graphs on your website for free." https://www.chartjs.org/
Pre-requisite?
We have two prerequisites that must be loaded at every each view with a chart as content, and they are the Jquery and Chart.js libraries:
What is chart.js?
"Simple, clean and engaging HTML5 based JavaScript charts. Chart.js is an easy way to include animated, interactive graphs on your website for free." https://www.chartjs.org/
Pre-requisite?
We have two prerequisites that must be loaded at every each view with a chart as content, and they are the Jquery and Chart.js libraries:
- <script src="https://cdnjs.cloudflare.com/ajax/libs/Chart.js/2.7.2/Chart.bundle.min.js"></script>
- <script src="https://code.jquery.com/jquery-3.3.1.min.js"></script>
SimpleReportViewModel
- public class SimpleReportViewModel
- {
- public string DimensionOne { get; set; }
- public int Quantity { get; set; }
- }
- public class StackedViewModel
- {
- public string StackedDimensionOne { get; set; }
- public List<SimpleReportViewModel> LstData { get; set; }
- }
Controller Action
- public IActionResult Bar()
- {
- private Random rnd = new Random();
- //list of department
- var lstModel = new List<SimpleReportViewModel>();
- lstModel.Add( new SimpleReportViewModel
- {
- DimensionOne = "Technology",
- Quantity = rnd.Next( 10 )
- } );
- lstModel.Add( new SimpleReportViewModel
- {
- DimensionOne = "Sales",
- Quantity = rnd.Next( 10 )
- } );
- lstModel.Add( new SimpleReportViewModel
- {
- DimensionOne = "Marketing",
- Quantity = rnd.Next( 10 )
- } );
- lstModel.Add( new SimpleReportViewModel
- {
- DimensionOne = "Human Resource",
- Quantity = rnd.Next( 10 )
- } );
- lstModel.Add( new SimpleReportViewModel
- {
- DimensionOne = "Research and Development",
- Quantity = rnd.Next( 10 )
- } );
- lstModel.Add( new SimpleReportViewModel
- {
- DimensionOne = "Acconting",
- Quantity = rnd.Next( 10 )
- } );
- lstModel.Add( new SimpleReportViewModel
- {
- DimensionOne = "Support",
- Quantity = rnd.Next( 10 )
- } );
- lstModel.Add( new SimpleReportViewModel
- {
- DimensionOne = "Logistics",
- Quantity = rnd.Next( 10 )
- } );
- return View( lstModel );
- }
View
- @model List<SimpleReportViewModel>
- @{
- var XLabels = Newtonsoft.Json.JsonConvert.SerializeObject( Model.Select( x => x.DimensionOne ).ToList() );
- var YValues = Newtonsoft.Json.JsonConvert.SerializeObject( Model.Select( x => x.Quantity ).ToList() );
- ViewData["Title"] = "Bar Chart";
- }
- <!DOCTYPE html>
- <html>
- <head>
- <meta name="viewport" content="width=device-width" />
- <title>Bar</title>
- </head>
- <body>
- <div class="box-body">
- <div class="chart-container">
- <canvas id="chart" style="width:100%; height:500px"></canvas>
- </div>
- </div>
- </body>
- </html>
- <script src="https://cdnjs.cloudflare.com/ajax/libs/Chart.js/2.7.2/Chart.bundle.min.js"></script>
- <script src="https://code.jquery.com/jquery-3.3.1.min.js"></script>
- <script type="text/javascript">
- $(function () {
- var chartName = "chart";
- var ctx = document.getElementById(chartName).getContext('2d');
- var data = {
- labels: @Html.Raw(XLabels),
- datasets: [{
- label: "Departments Chart",
- backgroundColor: [
- 'rgba(255, 99, 132, 0.2)',
- 'rgba(54, 162, 235, 0.2)',
- 'rgba(255, 206, 86, 0.2)',
- 'rgba(75, 192, 192, 0.2)',
- 'rgba(153, 102, 255, 0.2)',
- 'rgba(255, 159, 64, 0.2)',
- 'rgba(255, 0, 0)',
- 'rgba(0, 255, 0)',
- 'rgba(0, 0, 255)',
- 'rgba(192, 192, 192)',
- 'rgba(255, 255, 0)',
- 'rgba(255, 0, 255)'
- ],
- borderColor: [
- 'rgba(255,99,132,1)',
- 'rgba(54, 162, 235, 1)',
- 'rgba(255, 206, 86, 1)',
- 'rgba(75, 192, 192, 1)',
- 'rgba(153, 102, 255, 1)',
- 'rgba(255, 159, 64, 1)',
- 'rgba(255, 0, 0)',
- 'rgba(0, 255, 0)',
- 'rgba(0, 0, 255)',
- 'rgba(192, 192, 192)',
- 'rgba(255, 255, 0)',
- 'rgba(255, 0, 255)'
- ],
- borderWidth: 1,
- data: @Html.Raw(YValues)
- }]
- };
- var options = {
- maintainAspectRatio: false,
- scales: {
- yAxes: [{
- ticks: {
- min: 0,
- beginAtZero: true
- },
- gridLines: {
- display: true,
- color: "rgba(255,99,164,0.2)"
- }
- }],
- xAxes: [{
- ticks: {
- min: 0,
- beginAtZero: true
- },
- gridLines: {
- display: false
- }
- }]
- }
- };
- var myChart = new Chart(ctx, {
- options: options,
- data: data,
- type:'bar'
- });
- });
- </script>
Result
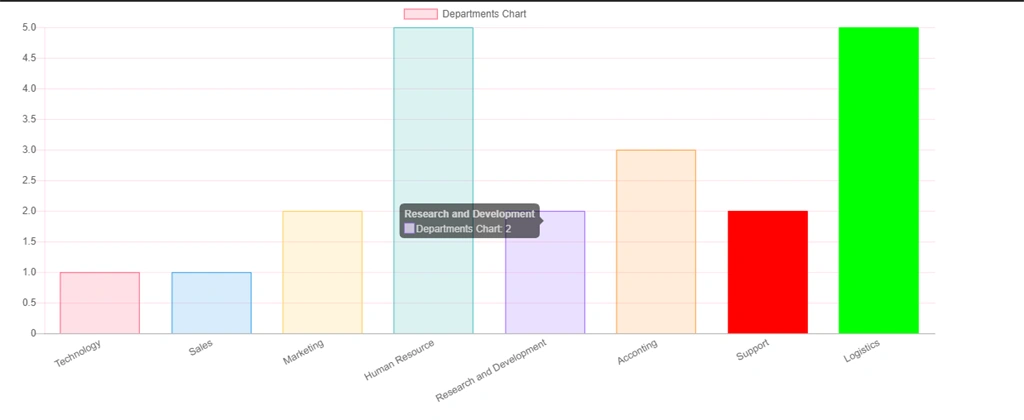
Here we use the SimpleReportViewModel because we have a simple bar chart with a department list and their head number
Pie Chart
Controller Action
- public IActionResult Pie()
- {
- private Random rnd = new Random();
- //list of drinks
- var lstModel = new List<SimpleReportViewModel>();
- lstModel.Add( new SimpleReportViewModel
- {
- DimensionOne = "Beer",
- Quantity = rnd.Next( 10 )
- } );
- lstModel.Add( new SimpleReportViewModel
- {
- DimensionOne = "Wine",
- Quantity = rnd.Next( 10 )
- } );
- lstModel.Add( new SimpleReportViewModel
- {
- DimensionOne = "Whisky",
- Quantity = rnd.Next( 10 )
- } );
- lstModel.Add( new SimpleReportViewModel
- {
- DimensionOne = "Water",
- Quantity = rnd.Next( 10 )
- } );
- return View( lstModel );
- }
View
- @using System.Linq;
- @model List<SimpleReportViewModel>
- @{
- var XLabels = Newtonsoft.Json.JsonConvert.SerializeObject( Model.Select( x => x.DimensionOne ).ToList() );
- var YValues = Newtonsoft.Json.JsonConvert.SerializeObject( Model.Select( x => x.Quantity ).ToList() );
- ViewData["Title"] = "Pie Chart";
- }
- <!DOCTYPE html>
- <html>
- <head>
- <meta name="viewport" content="width=device-width" />
- <title>Pie</title>
- </head>
- <body>
- <div class="box-body">
- <div class="chart-container">
- <canvas id="chart" style="width:100%; height:500px"></canvas>
- </div>
- </div>
- </body>
- </html>
- <script src="https://cdnjs.cloudflare.com/ajax/libs/Chart.js/2.7.2/Chart.bundle.min.js"></script>
- <script src="https://code.jquery.com/jquery-3.3.1.min.js"></script>
- <script type="text/javascript">
- $(function () {
- var chartName = "chart";
- var ctx = document.getElementById(chartName).getContext('2d');
- var data = {
- labels: @Html.Raw(XLabels),
- datasets: [{
- label: "Drinks Chart",
- backgroundColor: [
- 'rgba(255, 99, 132, 0.2)',
- 'rgba(54, 162, 235, 0.2)',
- 'rgba(255, 206, 86, 0.2)',
- 'rgba(75, 192, 192, 0.2)',
- 'rgba(153, 102, 255, 0.2)',
- 'rgba(255, 159, 64, 0.2)',
- 'rgba(255, 0, 0)',
- 'rgba(0, 255, 0)',
- 'rgba(0, 0, 255)',
- 'rgba(192, 192, 192)',
- 'rgba(255, 255, 0)',
- 'rgba(255, 0, 255)'
- ],
- borderColor: [
- 'rgba(255,99,132,1)',
- 'rgba(54, 162, 235, 1)',
- 'rgba(255, 206, 86, 1)',
- 'rgba(75, 192, 192, 1)',
- 'rgba(153, 102, 255, 1)',
- 'rgba(255, 159, 64, 1)',
- 'rgba(255, 0, 0)',
- 'rgba(0, 255, 0)',
- 'rgba(0, 0, 255)',
- 'rgba(192, 192, 192)',
- 'rgba(255, 255, 0)',
- 'rgba(255, 0, 255)'
- ],
- borderWidth: 1,
- data: @Html.Raw(YValues)
- }]
- };
- var options = {
- maintainAspectRatio: false,
- scales: {
- yAxes: [{
- ticks: {
- min: 0,
- beginAtZero: true
- },
- gridLines: {
- display: true,
- color: "rgba(255,99,164,0.2)"
- }
- }],
- xAxes: [{
- ticks: {
- min: 0,
- beginAtZero: true
- },
- gridLines: {
- display: false
- }
- }]
- }
- };
- var myChart = new Chart(ctx, {
- options: options,
- data: data,
- type:'pie'
- });
- });
- </script>
Result
Explanation
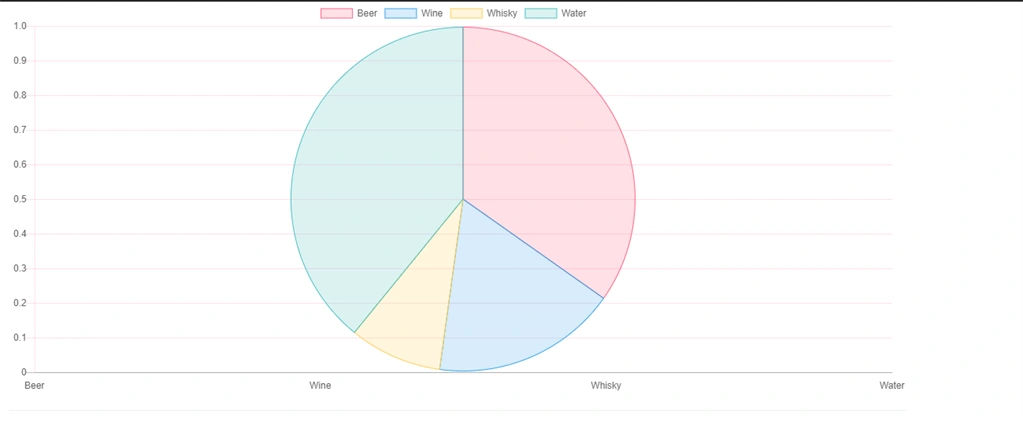
Here we also use the SimpleReportViewModel because we have a simple pie chart with a drink list and their quantity number.
Line Chart
Controller Action
Line Chart
Controller Action
- public IActionResult Line()
- {
- private Random rnd = new Random();
- //list of countries
- var lstModel = new List<SimpleReportViewModel>();
- lstModel.Add( new SimpleReportViewModel
- {
- DimensionOne = "Brazil",
- Quantity = rnd.Next( 10 )
- } );
- lstModel.Add( new SimpleReportViewModel
- {
- DimensionOne = "USA",
- Quantity = rnd.Next( 10 )
- } );
- lstModel.Add( new SimpleReportViewModel
- {
- DimensionOne = "Portugal",
- Quantity = rnd.Next( 10 )
- } );
- lstModel.Add( new SimpleReportViewModel
- {
- DimensionOne = "Russia",
- Quantity = rnd.Next( 10 )
- } );
- lstModel.Add( new SimpleReportViewModel
- {
- DimensionOne = "Ireland",
- Quantity = rnd.Next( 10 )
- } );
- lstModel.Add( new SimpleReportViewModel
- {
- DimensionOne = "Germany",
- Quantity = rnd.Next( 10 )
- } );
- return View( lstModel );
- }
View
- @model List<SimpleReportViewModel>
- @{
- var XLabels = Newtonsoft.Json.JsonConvert.SerializeObject( Model.Select( x => x.DimensionOne ).ToList() );
- var YValues = Newtonsoft.Json.JsonConvert.SerializeObject( Model.Select( x => x.Quantity ).ToList() );
- ViewData["Title"] = "Line Chart";
- }
- <!DOCTYPE html>
- <html>
- <head>
- <meta name="viewport" content="width=device-width" />
- <title>Line</title>
- </head>
- <body>
- <div class="box-body">
- <div class="chart-container">
- <canvas id="chart" style="width:100%; height:500px"></canvas>
- </div>
- </div>
- </body>
- </html>
- <script src="https://cdnjs.cloudflare.com/ajax/libs/Chart.js/2.7.2/Chart.bundle.min.js"></script>
- <script src="https://code.jquery.com/jquery-3.3.1.min.js"></script>
- <script type="text/javascript">
- $(function () {
- var chartName = "chart";
- var ctx = document.getElementById(chartName).getContext('2d');
- var data = {
- labels: @Html.Raw(XLabels),
- datasets: [{
- label: "Countries Chart",
- backgroundColor: [
- 'rgba(255, 99, 132, 0.2)',
- 'rgba(54, 162, 235, 0.2)',
- 'rgba(255, 206, 86, 0.2)',
- 'rgba(75, 192, 192, 0.2)',
- 'rgba(153, 102, 255, 0.2)',
- 'rgba(255, 159, 64, 0.2)',
- 'rgba(255, 0, 0)',
- 'rgba(0, 255, 0)',
- 'rgba(0, 0, 255)',
- 'rgba(192, 192, 192)',
- 'rgba(255, 255, 0)',
- 'rgba(255, 0, 255)'
- ],
- borderColor: [
- 'rgba(255,99,132,1)',
- 'rgba(54, 162, 235, 1)',
- 'rgba(255, 206, 86, 1)',
- 'rgba(75, 192, 192, 1)',
- 'rgba(153, 102, 255, 1)',
- 'rgba(255, 159, 64, 1)',
- 'rgba(255, 0, 0)',
- 'rgba(0, 255, 0)',
- 'rgba(0, 0, 255)',
- 'rgba(192, 192, 192)',
- 'rgba(255, 255, 0)',
- 'rgba(255, 0, 255)'
- ],
- borderWidth: 1,
- data: @Html.Raw(YValues)
- }]
- };
- var options = {
- maintainAspectRatio: false,
- scales: {
- yAxes: [{
- ticks: {
- min: 0,
- beginAtZero: true
- },
- gridLines: {
- display: true,
- color: "rgba(255,99,164,0.2)"
- }
- }],
- xAxes: [{
- ticks: {
- min: 0,
- beginAtZero: true
- },
- gridLines: {
- display: false
- }
- }]
- }
- };
- var myChart = new Chart(ctx, {
- options: options,
- data: data,
- type:'line'
- });
- });
- </script>
Result
Explanation
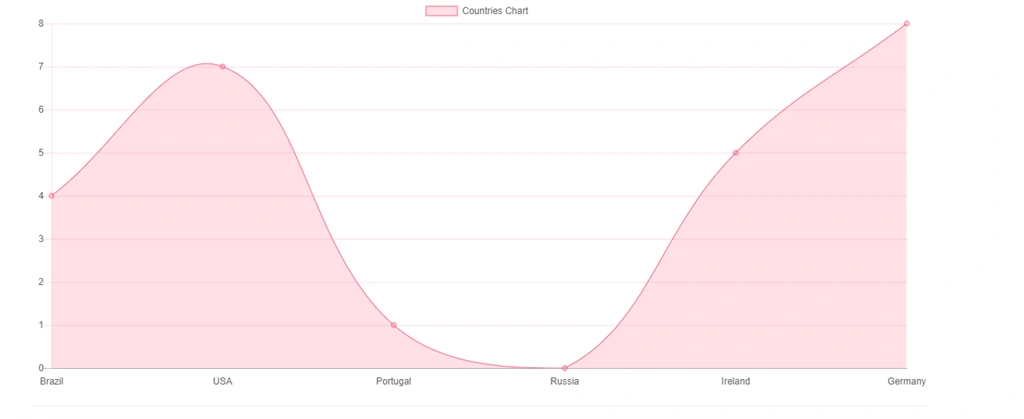
Here we also use the SimpleReportViewModel because we have a simple line chart with a country list and their quantity number.
Stacked Chart
Controller Action
Stacked Chart
Controller Action
- public IActionResult Stacked()
- {
- private Random rnd = new Random();
- var lstModel = new List<StackedViewModel>();
- //sales of product sales by quarter
- lstModel.Add( new StackedViewModel
- {
- StackedDimensionOne = "First Quarter",
- LstData = new List<SimpleReportViewModel>()
- {
- new SimpleReportViewModel()
- {
- DimensionOne="TV",
- Quantity = rnd.Next(10)
- },
- new SimpleReportViewModel()
- {
- DimensionOne="Games",
- Quantity = rnd.Next(10)
- },
- new SimpleReportViewModel()
- {
- DimensionOne="Books",
- Quantity = rnd.Next(10)
- }
- }
- } );
- lstModel.Add( new StackedViewModel
- {
- StackedDimensionOne = "Second Quarter",
- LstData = new List<SimpleReportViewModel>()
- {
- new SimpleReportViewModel()
- {
- DimensionOne="TV",
- Quantity = rnd.Next(10)
- },
- new SimpleReportViewModel()
- {
- DimensionOne="Games",
- Quantity = rnd.Next(10)
- },
- new SimpleReportViewModel()
- {
- DimensionOne="Books",
- Quantity = rnd.Next(10)
- }
- }
- } );
- lstModel.Add( new StackedViewModel
- {
- StackedDimensionOne = "Third Quarter",
- LstData = new List<SimpleReportViewModel>()
- {
- new SimpleReportViewModel()
- {
- DimensionOne="TV",
- Quantity = rnd.Next(10)
- },
- new SimpleReportViewModel()
- {
- DimensionOne="Games",
- Quantity = rnd.Next(10)
- },
- new SimpleReportViewModel()
- {
- DimensionOne="Books",
- Quantity = rnd.Next(10)
- }
- }
- } );
- lstModel.Add( new StackedViewModel
- {
- StackedDimensionOne = "Fourth Quarter",
- LstData = new List<SimpleReportViewModel>()
- {
- new SimpleReportViewModel()
- {
- DimensionOne="TV",
- Quantity = rnd.Next(10)
- },
- new SimpleReportViewModel()
- {
- DimensionOne="Games",
- Quantity = rnd.Next(10)
- },
- new SimpleReportViewModel()
- {
- DimensionOne="Books",
- Quantity = rnd.Next(10)
- }
- }
- } );
- return View( lstModel );
- }
View
Result
- @model List < StackedViewModel > @ {
- var XLabels = Newtonsoft.Json.JsonConvert.SerializeObject(Model.FirstOrDefault().LstData.Select(x => x.DimensionOne).ToList());
- var YValues = Newtonsoft.Json.JsonConvert.SerializeObject(Model.Select(x => x.LstData.Select(w => w.Quantity)).ToList());
- var label2 = Newtonsoft.Json.JsonConvert.SerializeObject(Model.Select(x => x.StackedDimensionOne).ToList());
- ViewData["Title"] = "Stacked Chart";
- } < !DOCTYPE html > < html > < head > < meta name = "viewport"
- content = "width=device-width" / > < title > Stacked < /title> < /head> < body > < div class = "box-body" > < div class = "chart-container" > < canvas id = "chartStacked"
- style = "width:100%; height:500px" > < /canvas> < /div> < /div> < /body> < /html> < script src = "https://cdnjs.cloudflare.com/ajax/libs/Chart.js/2.7.2/Chart.bundle.min.js" > < /script> < script src = "https://code.jquery.com/jquery-3.3.1.min.js" > < /script> < script type = "text/javascript" > $(function() {
- var chartName = "chartStacked";
- var ctx = document.getElementById(chartName).getContext('2d');
- var XLabels = @Html.Raw(XLabels);
- var YValues = @Html.Raw(YValues);
- var label = @Html.Raw(label2);
- var aux = 0;
- var barChartData = {
- labels: @Html.Raw(label2),
- datasets: []
- }
- XLabels.forEach(function(a, i) {
- var data = [];
- YValues.forEach(function(a, i) {
- data.push(a[aux]);
- });
- barChartData.datasets.push({
- label: XLabels[aux],
- backgroundColor: random_rgba(),
- data: data
- });
- aux++;
- });
- var options = {
- maintainAspectRatio: false,
- scales: {
- yAxes: [{
- ticks: {
- min: 0,
- beginAtZero: true
- },
- stacked: true,
- gridLines: {
- display: true,
- color: "rgba(255,99,164,0.2)"
- }
- }],
- xAxes: [{
- stacked: true,
- gridLines: {
- display: false
- }
- }]
- }
- };
- function random_rgba() {
- var o = Math.round,
- r = Math.random,
- s = 255;
- return 'rgba(' + o(r() * s) + ',' + o(r() * s) + ',' + o(r() * s) + ',' + r().toFixed(1) + ')';
- }
- var myChart = new Chart(ctx, {
- options: options,
- data: barChartData,
- type: 'bar'
- });
- }); < /script>
Explanation
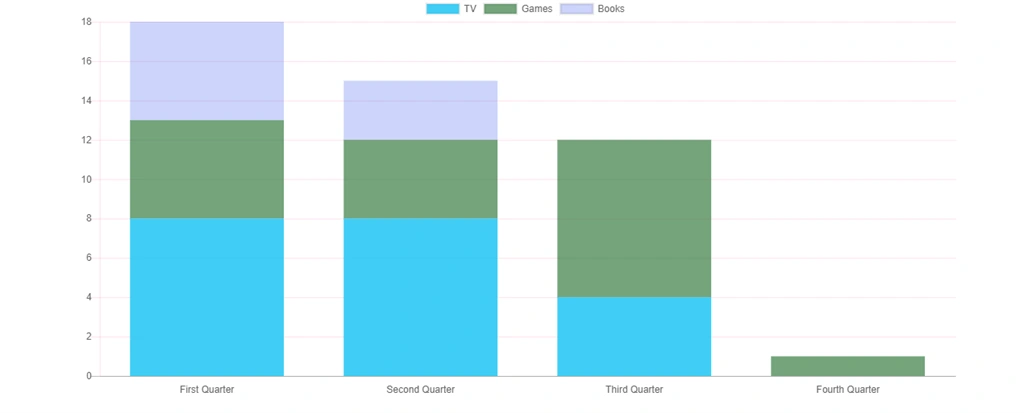
Here we use the StackedViewModel because we have a stacked chart with the number of product sales by quarter.
Ps.: Javascript is needed here to order the data from the model to chart.js dataset.
Here we use the StackedViewModel because we have a stacked chart with the number of product sales by quarter.
Ps.: Javascript is needed here to order the data from the model to chart.js dataset.
Congratulations, you have successfully integrated Chart.Js with your Asp.net Core application.
Kanan GarazadaPosted Aug 15, 2021, 12:53 AM
Thank You very much you are perfect
Harvey TrianaPosted Oct 27, 2020, 10:23 AM
Clear and clean. Thank you.
vijendra singhPosted Jun 25, 2020, 4:35 AM
The xAxis name are not visible if yAxis value is 0 in bar char. Can you suggest a solution ?
lalit bhardwajPosted Apr 21, 2020, 12:18 AM
These are good example for chart.js core. I want to use group bar chart with database. Could you suggest me or share any example or reference .
Francis AmootiPosted Aug 11, 2019, 12:47 PM
How do i add data from a mode rather than a random number generated everytime. Like add data from one property of the model
Mike DoerrPosted Jul 4, 2019, 9:48 AM
Fantastic! Thank you for this.
Michael WhitePosted Nov 2, 2018, 2:16 PM
These work great as long as they are in a Razor page, but I can't seem to get a chart to render within a Razor view. I suspect the script is not firing within the view, any advice?
Paulo AssunçãoPosted Oct 23, 2018, 10:42 AM
Hi, awesome article, thank you very much for it. By the way, how do I put the labels for the pie chart on the left, instead of on top? Thank you
José SánchezPosted Jun 7, 2018, 10:26 AM
Thank you so much for code! It is very helpfull. I would like to ask you if it is possible to load charts in Index.cshtml, without links.
Naresh SinghalPosted Apr 26, 2018, 11:53 PM
Very well explained Bro @Thiago .....