

In this walk-through, you will learn how to create a graph using the Windows Form App (WinForm) step by step.
By default, chart control is not available in the toolbox. You have to install first the chart option, then proceed towards CHART preparation.
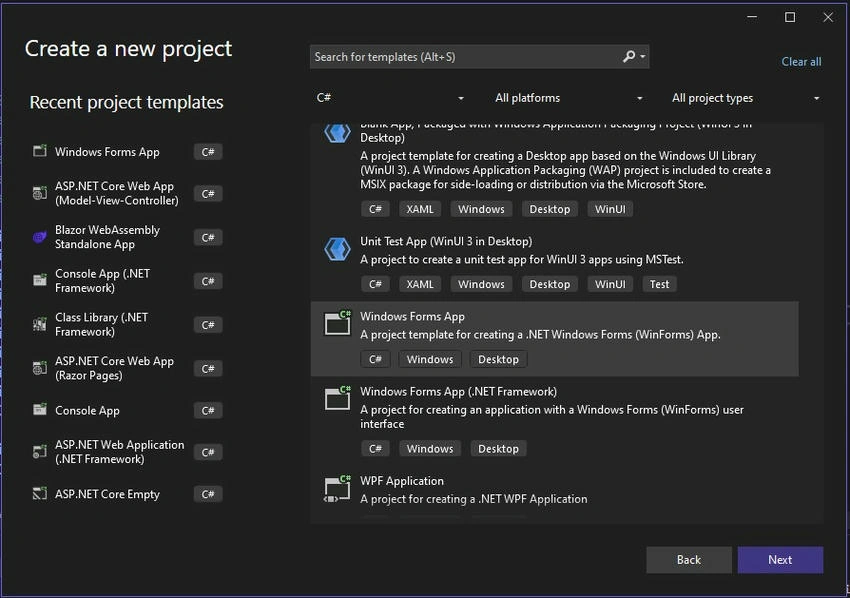
Create Project using template “Windows Forms App”
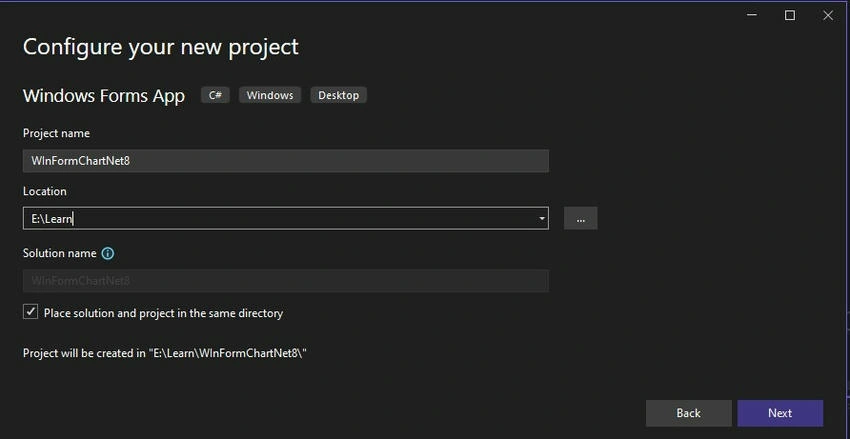
Set your project name and Location, which means the path of the project.
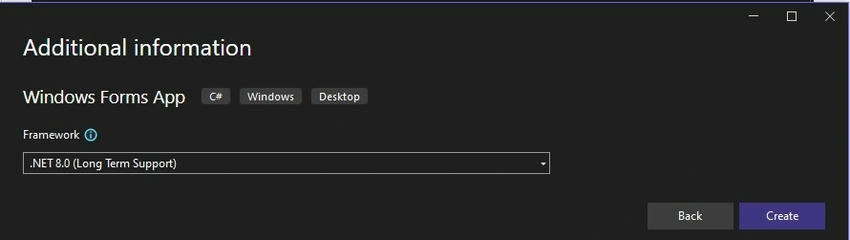
Select Your Framework .Net Version and create the project.
Search the Chart in the toolbox, you will come to know that there is no CHART control.
Install NugGet: System.Windows.Forms.DataVisualization
Right-click on Project and select Manage NuGet packages.
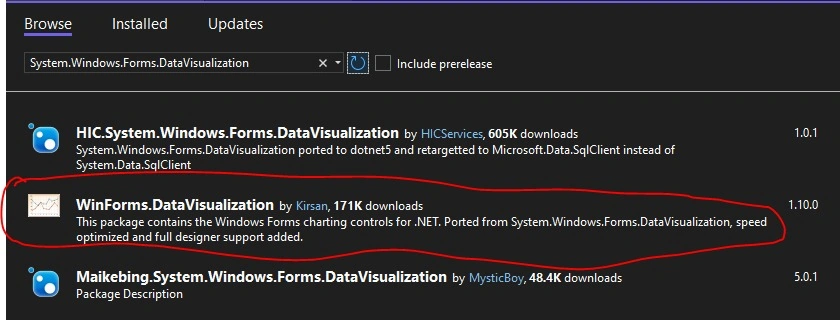
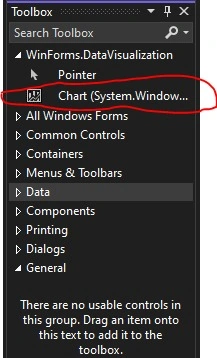
After installation, you can seethe Chart option is visible. Now, drag and drop the chart control on the Form1 canvas.
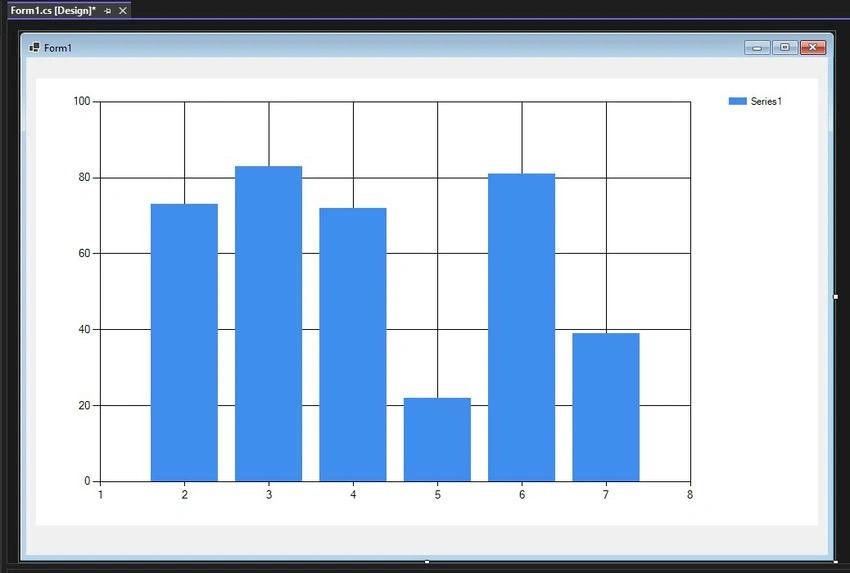
Double-click on the Form1 canvas area or press F7 on Form1 and enter the following code using the Inside Form1_Laod method.
private void Form1_Load(object sender, EventArgs e)
{
    this.Text = "How to Create Chart WinForm .NET 8";

    // Clear ChartAreas, Series
    chart1.ChartAreas.Clear();
    chart1.Series.Clear();

    // Create Chart Area
    ChartArea chartArea = new ChartArea("GraphArea");
    chartArea.AxisX.Title = "Months";
    chartArea.AxisY.Title = "Rs. In Lakhs";

    // Add Chart Area
    chart1.ChartAreas.Add(chartArea);

    // Create a Series and set type to Bar
    Series series = new Series("Sales")
    {
        ChartType = SeriesChartType.Bar,
        IsValueShownAsLabel = true
    };

    // Add Data Points
    series.Points.AddXY(1, 150);
    series.Points.AddXY(2, 70);
    series.Points.AddXY(3, 90);
    series.Points.AddXY(4, 150);
    series.Points.AddXY(5, 170);
    series.Points.AddXY(6, 90);
    series.Points.AddXY(7, 130);
    series.Points.AddXY(8, 70);
    series.Points.AddXY(9, 190);
    series.Points.AddXY(10, 120);
    series.Points.AddXY(11, 90);
    series.Points.AddXY(12, 70);

    // Add Series to Chart
    chart1.Series.Add(series);

    // Set Fonts
    series.Font = new Font("Verdana", 11);
    chart1.ChartAreas[0].AxisY.LabelStyle.Font = new Font("Segoe UI", 9);
}
Output
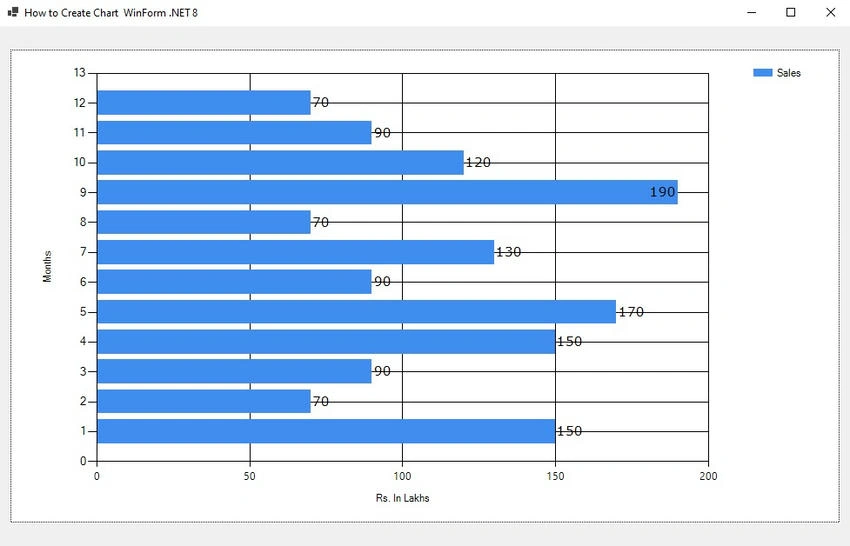
To change the Chart Type, set the following property.
// Create a Series and set type to Bar
Series series = new Series("Sales")
{
    ChartType = SeriesChartType.Line,
    IsValueShownAsLabel = true
};
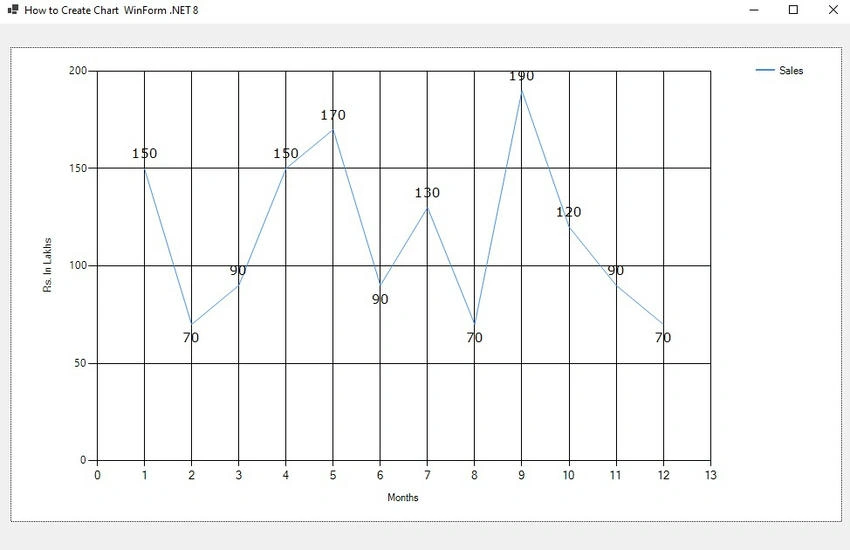
Happy Coding!
Join the conversation! Your thoughts help the community grow.