

Introduction
ChartJS is one of the most widely used open-source dashboard solutions across many platforms. Leveraging an HTML5 canvas, its great rendering, and responsive performances across browsers make it a developer’s first choice.
This article will explain how to create a simple graph with the below data in simple HTML. We will use the simple dataset below (top 5 longest rivers of the world) to showcase a few of the graphs,
| River | Length in KMs |
| Nile | 6650 |
| Amazon | 6400 |
| Yangtze | 6300 |
| Mississippi | 6275 |
| Yenisei | 5539 |
Getting Started
We start with a simple skeleton of HTML5. Place just a canvas element with id “myChartContainer”.
Now, ChartJS requires jQuery, Bootstrap and its ChartJS libraries. You can link them from CDN in your HTML page –
At this point, the HTML and the webpage would look like,
- <!DOCTYPEhtml>
- <html>
- <head>
- <metacharset="utf-8"/>
- <metahttp-equiv="X-UA-Compatible"content="IE=edge">
- <title>Chart JS Demo</title>
- <scripttype="text/javascript"src="https://ajax.googleapis.com/ajax/libs/jquery/3.3.1/jquery.min.js">
- </script>
- <scripttype="text/javascript"src="https://cdn.jsdelivr.net/npm/[email protected]/dist/Chart.min.js">
- </script>
- <linkrel="stylesheet"href="https://stackpath.bootstrapcdn.com/bootstrap/4.3.1/css/bootstrap.min.css"/>
- </head>
- <body>
- <divstyle="width: 100%; text-align: center">
- This space is reserved for my Chart JS graphs!
- <br>
- <br>
- <buttononclick="GenerateChart()">Generate Chart
- </button>
- <br>
- <br>
- <divstyle="position: relative; height:800px; width:800px">
- <canvasid="myChartContainer"style="border:1px solid">
- </canvas>
- </div>
- </body>
- </html>
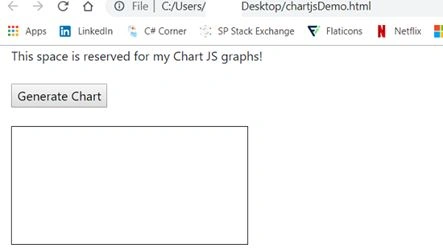
Adding the ChartJS elements inside your HTML
Now, moving on to the fun part! We have added a button – Generate Chart and have added a function GenerateChart() on its onClick event.
Within the script tags, we will get the context of the canvas where the chart will be rendered and store it in a variable ‘ctx’
To make it easy, we will have a look at the minimal code representation of a dashboard. Below is the entire code – we will have explanations/description of the prime elements after the code,
- <!DOCTYPEhtml >
- <html >
- <head >
- <metacharset = "utf-8" / >
- <metahttp - equiv = "X-UA-Compatible"
- content = "IE=edge" >
- <title > Chart JS Demo < /title>
- <scripttype = "text/javascript"
- src = "https://ajax.googleapis.com/ajax/libs/jquery/3.3.1/jquery.min.js" > < /script> <
- scripttype = "text/javascript"
- src = "https://cdn.jsdelivr.net/npm/[email protected]/dist/Chart.min.js" > < /script> <
- linkrel = "stylesheet"
- href = "https://stackpath.bootstrapcdn.com/bootstrap/4.3.1/css/bootstrap.min.css" / >
- <script >
- functionGenerateChart() {
- myLabels = ['Nile', 'Amazon', 'Yangtze', 'Mississippi', 'Yenisei'];
- myData = [6650, 6400, 6300, 6275, 5539];
- varctx = document.getElementById('myChartContainer').getContext('2d');
- varmyChart = newChart(ctx, {
- type: 'horizontalBar', // bar, horizontalBar, pie , line, doughnut, radar, polarArea
- data: {
- labels: myLabels,
- datasets: [{
- label: 'Length of River',
- data: myData,
- backgroundColor: ['green', 'red', 'blue', 'purple', 'black'],
- borderWidth: 1,
- borderColor: 'black',
- hoverBorderWidth: 3,
- hoverBorderColor: 'black',
- }]
- },
- options: {
- maintainAspectRatio: true,
- title: {
- display: true,
- text: 'Top 5 rivers of the world!',
- fontSize: 20
- },
- legend: {
- display: true,
- position: 'right',
- labels: {
- fontColor: '#000',
- }
- },
- tooltips: {
- enabled: true
- }
- }
- });
- }
- </script>
- </head>
- <body >
- This space is reserved
- for my Chart JS graphs! < br > < br >
- <buttononclick = "GenerateChart()" > Generate Chart < /button><br><br>
- <divstyle = "position: relative; height:800px; width:800px" >
- <canvasid = "myChartContainer"
- style = "border:1px solid" > < /canvas> <
- /div>
- </body>
- </html>
So, this is how ChartJS is instantiated in your HTML DOM,
- varctx = document.getElementById('myChartContainer').getContext('2d');
- varmyChart = newChart(ctx, {//... the usual chartJS configs...//});
Chart JS relies on 3 major components. The 3 of them are explained below,
| Type | This indicates the type of graph you need. | Acceptable values are – · Bar · horizontalBar · pie · line · doughnut · radar · polarArea |
| Data | This is where the actual data is targeted. It has 2 basic types – · Labels (where all the labels are defined as arrays) · Datasets (where the actual data resides along with how the data is interpreted) | Datasets can have the below components · label (label of the graph) · data (the MAIN data) · backgroundColor (color for all the bars, pie sections, etc. Must be an array and should match the number of data sets) · borderWidth (sample value - 1) · borderColor(sample value - red) · hoverBorderWidth (sample value - 2) · hoverBorderColor (sample value - 'black') · hoverBackgroundColor (sample value - 'black') |
| Options | This is where you specify all the configuration options | A few configuration values include below - · title · legend · layout · tooltips (enabled – true/false) |
So, that pretty much covers the code. Now – time to have a look at the graph!
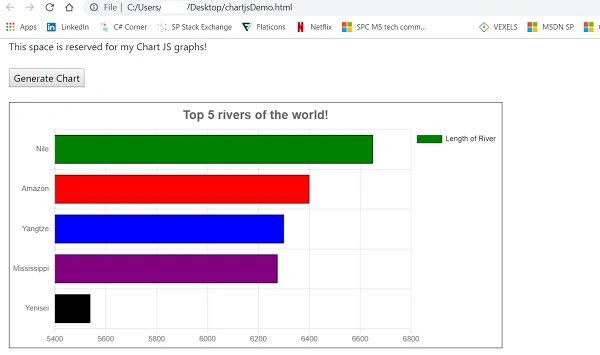
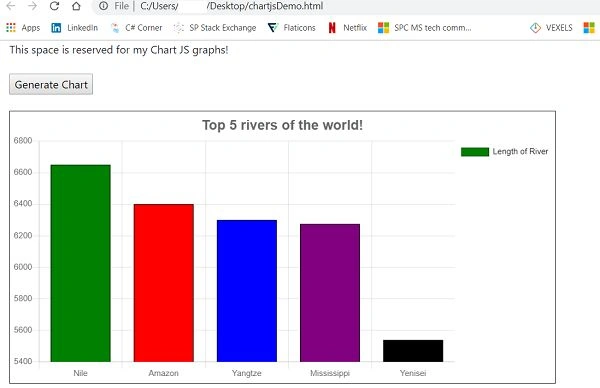
Don't like the horizontalBar graph? No problem! Just change the type to “bar” and see the magic. That’s how interactive these graphs are!
Join the conversation! Your thoughts help the community grow.