

In this article, you will find out how to create AngularJS charts in MVC application. To show you the detailed steps,a few client side libraries are required and those can be added either using NuGet package manager or using Bower or also referred from CDN. In this article, I am going to use Bower to install required libraries. There are many ways to install Bower; here I prefer npm(Node Package Manager) to install Bower.
Getting started
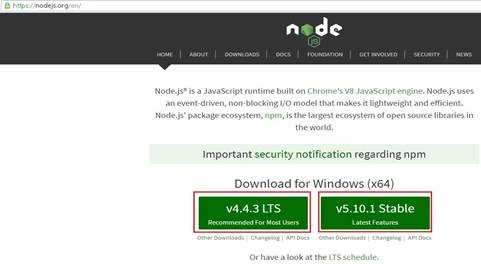
Step 1 - Install Node.js
The very first step we have to install Node.js, you can install Node.js from the below URL,
Step 2 - Confirm Node.js is installed
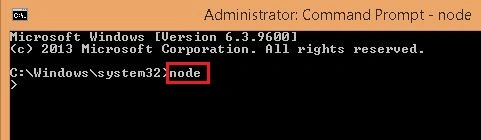
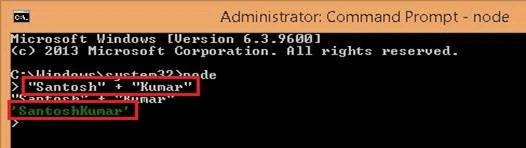
Open windows command prompt and type as “node” then we should get prompted with “>”.
Step 3 - Install Bower
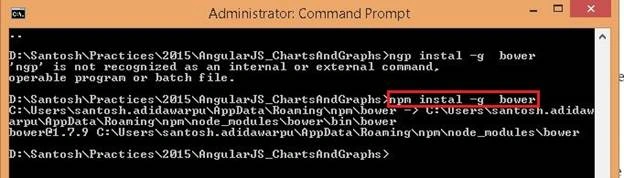
Set the folder location where you would like to install Bower and in windows command prompt type “npm install-g bower” to install Bower. If you observe the command we are using “-g”, here “-g” means global that means we can install Bower from any directory.
Step 4 - Check Bower is installed
If you try for searching Jquery libraries using Bower then it should give you some result, so that you can confirm that Bower is being successfully installed in your selected folder structure.
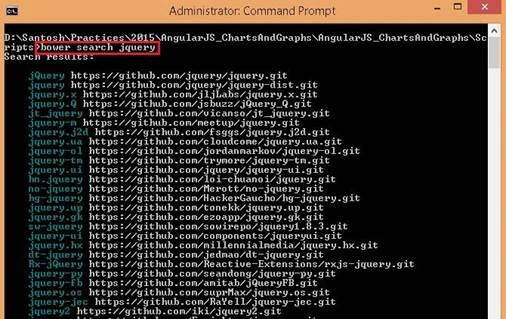
Step 5 - Install Dependencies (Jquery and AngularJS etc.)
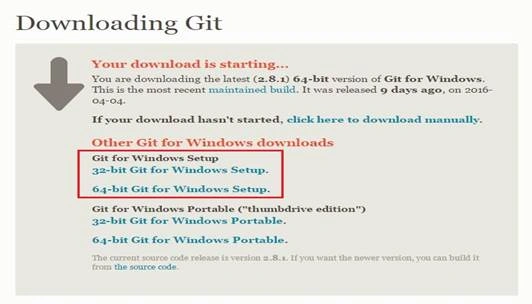
In the command window set the folder path and type “bower install Jquery” and press [Enter] from keyboard. If the Git is not installed then you will get an error message like “Git is not installed or not in the PATH”. If you are getting such kind of error then you have to install Git first. You can download Git from the below URL and install into your system.
https://git-scm.com/download/win
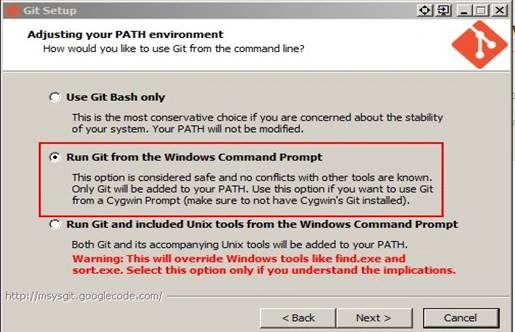
During installation it will ask you three options to adjust your PATH environment; you have to select “Run Git from the Windows Command Prompt” as you are working on Windows OS. Screenshot for reference:
Step 6 - Install Dependencies (Jquery and AngularJS etc.) again
Note
If you try to install Jquery again with the currently opened command prompt then you should get the same error. So close the currently opened command prompt. Open a new Windows command window and set the actual path where we want to install the required libraries.
Now type “bower install Jquery” in the Windows command prompt; this time it will install successfully as Git is already installed in your system.
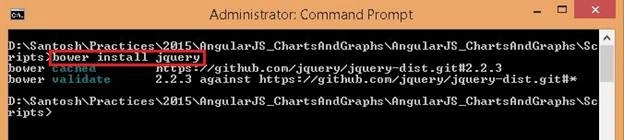
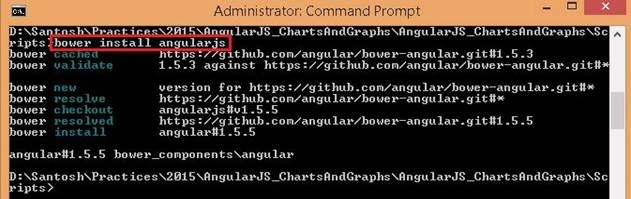
Now install AngularJS by typing “bower install angularjs” in windows command prompt.
Step 7- Install tc-angular-chartjs via bower
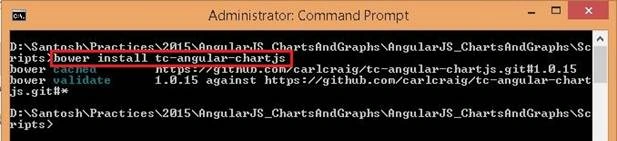
Now install “tc-angular-chartjs” by typing “bower install tc-angular-chartjs” from command prompt.
Step 8 - Confirm Dependencies Installed
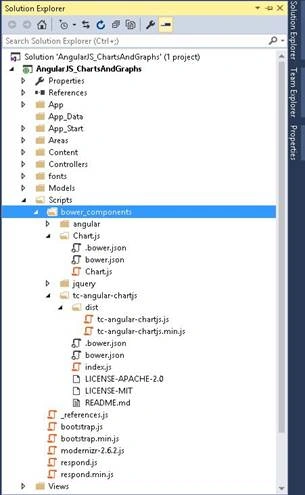
There should be a new folder in the given location created by Bower called "ower_components" where all installed components like Jquery and AngularJS etc. should have been installed at that location. Below screenshot for reference:
Now type “bower install Jquery” then it will successfully install into your system.
Now all required libraries are available with us; now it's time to show you how to generate Line Chart, Bar Chart, Doughnut Chart, Pie Chart, Polar Area Chart and Radar Chart in MVC application.
tc-angular-chartjs.js is a JavaScript file which provides directives for the below list of chart types.
- Line Chart
- Bar Chart
- Radar Chart
- Polar Area Chart
- Pie Chart
- Doughnut Chart
- tc-chartjs-line
- tc-chartjs-bar
- tc-chartjs-radar
- tc-chartjs-polararea
- tc-chartjs-pie
- tc-chartjs-doughnut
To generate a required Chart.js chart, just place one of the above-listed directives on a canvas element and provide some data and options.
As in the article we are using AngularJS, we should provide data source by assigning $scope variables to chart-options and chart-data attributes. And these scope variables should be mapped to the canvas element. Below is code snippet.
Example:
- <canvastc-chartjs-polarareachart-data="sampleDataSource"chart-options="sampleOptions"width="250"height="250"></canvas>
- $scope.sampleDataSource =
[ - {value:300, color: "#F7464A" },
- {value:50, color : " #46BFBD" },
- {value:100, color : " #FDB45C" },
- {value: 30, color : "#949FB1"}
- ];
- $scope.sampleOptions=
{ - // Chart.js options should be here
- };
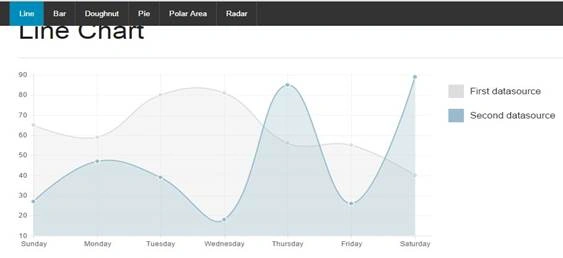
Line Chart
Add a model class
A model is a class which defines a data structure.
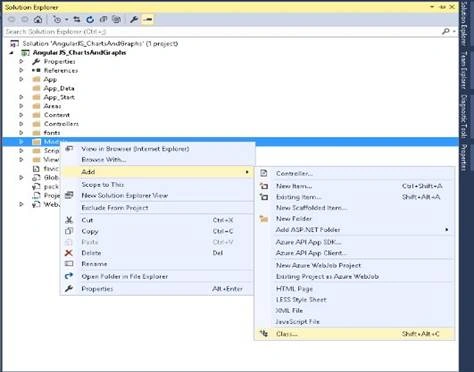
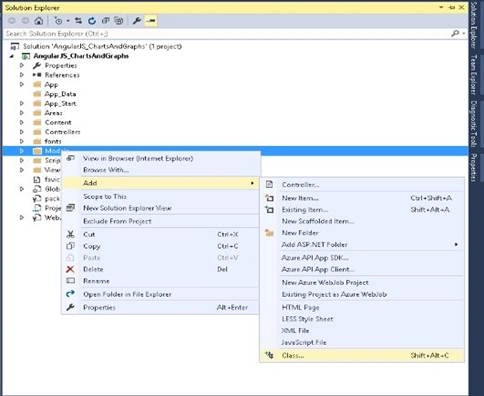
In Solution Explorer, Right-click on Model folder. And from the context menu, choose Add > Class.
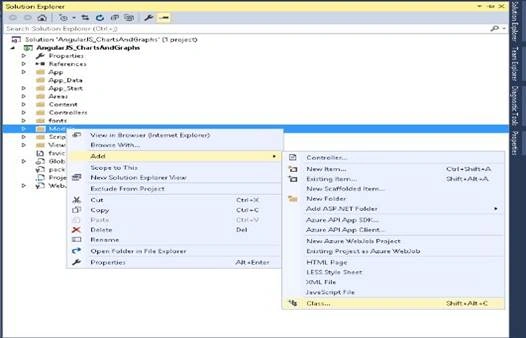
Add a model class “Line.cs” under Model folder.
- using System;
- using System.Collections.Generic;
- using System.Linq;
- using System.Web;
- namespace AngularJS_ChartsAndGraphs.Models
- {
- public class LineParent
- {
- public string[] labels
- {
- get;
- set;
- }
- public Line[] datasets
- {
- get;
- set;
- }
- }
- public classLine
- {
- public string label
- {
- get;
- set;
- }
- public string fillColor
- {
- get;
- set;
- }
- public string strokeColor
- {
- get;
- set;
- }
- public string pointColor
- {
- get;
- set;
- }
- public string pointStrokeColor
- {
- get;
- set;
- }
- public string pointHighlightFill
- {
- get;
- set;
- }
- public string pointHighlightStroke
- {
- get;
- set;
- }
- public int[] data
- {
- get;
- set;
- }
- }
- }
Add a “LineChart” controller class under the Controllers folder and set the inline data source.
- using AngularJS_ChartsAndGraphs.Models;
- using System;
- using System.Collections.Generic;
- using System.Linq;
- using System.Net;
- using System.Net.Http;
- using System.Web.Http;
- namespace AngularJS_ChartsAndGraphs.Controllers
- {
- public class LineChartController: ApiController
- {
- public LineParentGetData()
- {
- LineParent lineParent = new LineParent();
- Line[] objLine = newLine[2];
- Lineline = newLine();
- line.label = "First datasource";
- line.fillColor = "rgba(221,221,221,0.3)";
- line.strokeColor = "rgba(221,221,221,2)";
- line.pointColor = "rgba(221,221,221,2)";
- line.pointStrokeColor = "#fff";
- line.pointHighlightFill = "#fff";
- line.pointHighlightStroke = "rgba(221,221,221,2)";
- line.data = new int[7]
- {
- 65,59,80,81,56,55,40
- };
- Line line1 = new Line();
- line1.label = "Second datasource";
- line1.fillColor = "rgba(152,188,206,0.3)";
- line1.strokeColor = "rgba(152,188,206,2)";
- line1.pointColor = "rgba(152,188,206,2)";
- line1.pointStrokeColor = "#fff";
- line1.pointHighlightFill = "#fff";
- line1.pointHighlightStroke = "rgba(152,188,206,2)";
- line1.data = newint[7]
- {
- 27, 47,39,18,85,26,89
- };
- objLine = newLine[2]
- {
- line,
- line1
- };
- lineParent.datasets = objLine;
- lineParent.labels = newstring[7]
- {
- "Sunday","Monday","Tuesday","Wednesday","Thursday","Friday","Saturday"
- };
- return lineParent;
- }
- }
- }
Add a JS file and name it as line.js, in the file we are making service call to get the required data source and setting the options as per requirement.
- 'use strict';
- angular
- .module('app.line', [])
- .controller('LineCtrl', function($scope, $http) {
- $http.get('http://localhost:54796/API/LineChart').
- success(function(data, status, headers, config) {
- $scope.data = data;
- }).
- error(function(data, status, headers, config) {
- $scope.danger("Service call failed!");
- });
- $scope.options = {
- /// Set the responsive option either true or false
- responsive: true,
- ///Set thescaleShowGridLines option either true or false, if true then grid lines will be visible in the chart else not
- scaleShowGridLines: true,
- /// Set the grid linescolor
- scaleGridLineColor: 'rgba(0,0,0,.07)',
- /// Set the Width of the grid lines
- scaleGridLineWidth: 2,
- /// Set the bezierCurve option to true or false, if true thenthe line is curved between points else not
- bezierCurve: true,
- /// Set the points for the Tension of the Bezier curve
- bezierCurveTension: 0.5,
- ///This option is set to show a dot for each point
- pointDot: true,
- /// Set the Radius in number for each point dot in pixels
- pointDotRadius: 5,
- ///Set the width for point dot stroke in number to set its Pixel
- pointDotStrokeWidth: 2,
- /// Set this option in number to set the radius which hit detection outside the drawn point
- pointHitDetectionRadius: 19,
- /// This option decides whether to show a stroke for datasets
- datasetStroke: true,
- /// Set the pixel width of dataset stroke
- datasetStrokeWidth: 3,
- /// Set the option to either true or false, if true then dataset will fill with a color else not
- datasetFill: true,
- ///Write your custom code to execute while on animation progress
- onAnimationProgress: function() {},
- ///Write your custom code to execute while on animation complete
- onAnimationComplete: function() {},
- /// Customize your legend
- legendTemplate: '<ul class="tc-chart-js-legend"><% for (vari=0; i<datasets.length; i++){%><li><span style="background-color:<%=datasets[i].strokeColor%>"></span>
- <%if(datasets[i].label){%>
- <%=datasets[i].label%>
- <%}%> < /li><%}%></ul > '};});
Add the scripts reference in your HTML page,
- <script src="../js/thirdpartyJS/Jquery.js"></script>
- <script src="../js/thirdpartyJS/foundation.min.js"></script>
- <script src="../js/thirdpartyJS/angular.js"></script>
- <script src="../js/thirdpartyJS/Chart.js"></script>
- <script src="../js/thirdpartyJS/tc-angular-chartjs.js"></script>
- <script src="../js/app.js"></script>
- <script src="../js/line.js"></script>
- <link rel="stylesheet" href="../css/foundation.min.css">
- <link rel="stylesheet" href="../css/font-awesome.min.css">
- <link rel="stylesheet" href="../css/app.css">
- <!DOCTYPE html>
- <html data-ng-app="app">
- <head>
- <meta charset="utf-8">
- <meta name="viewport"content="width=device-width, initial-scale=1.0">
- <title>Line Chart - AngularJS</title>
- <!-- HEAD -->
- <link rel="stylesheet"href="../css/foundation.min.css">
- <link rel="stylesheet"href="../css/font-awesome.min.css">
- <link rel="stylesheet"href="../css/app.css">
- <!-- END HEAD -->
- </head>
- <body>
- <!-- TOP BAR -->
- <div class="contain-to-grid fixed">
- <nav class="top-bar"data-topbarrole="navigation">
- <ul class="title-area">
- <li class="toggle-topbar menu-icon">
- <a href="#">
- <span>Menu</span>
- </a>
- </li>
- </ul>
- <section class="top-bar-section">
- <ul class="left">
- <li class="divider">
- </li>
- <li class="active">
- <a href="">Line
- </a>
- </li>
- <li class="divider">
- </li>
- </ul>
- </section>
- </nav>
- </div>
- <!-- END TOP BAR -->
- <!-- CONTENT -->
- <div class="row"ng-controller="LineCtrl"style="margin-top:20px;">
- <div class="large-12 columns">
- <h1>Line Chart</h1>
- <hr>
- </div>
- <div class="medium-8 columns">
- <canvastc-chartjs-linechart-options="options"chart-data="data"chart-legend="lineChart1">
- </canvas>
- </div>
- <div class="medium-4 columns">
- <divtc-chartjs-legendchart-legend="lineChart1">
- </div>
- </div>
- </div>
- <!-- END CONTENT -->
- <!-- SCRIPTS -->
- <script src="../js/thirdpartyJS/Jquery.js">
- </script>
- <script src="../js/thirdpartyJS/foundation.min.js">
- </script>
- <script src="../js/thirdpartyJS/angular.js">
- </script>
- <script src="../js/thirdpartyJS/Chart.js">
- </script>
- <script src="../js/thirdpartyJS/tc-angular-chartjs.js">
- </script>
- <script src="../js/app.js">
- </script>
- <script src="../js/line.js">
- </script>
- <script>
- $(document).foundation();
- </script>
- <!-- END SCRIPTS -->
- </body>
- </html>
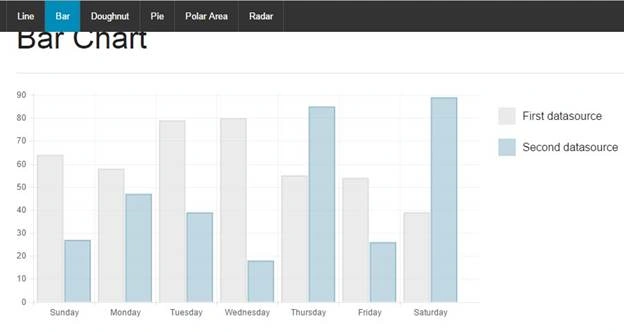
Bar Chart
Add a model class
A model is a class which defines a data structure.
In Solution Explorer, Right-click on Model folder. And from the context menu, choose Add > Class.
Add model class Bar.cs under Model folder.
- using System;
- using System.Collections.Generic;
- using System.Linq;
- using System.Web;
- namespace AngularJS_ChartsAndGraphs.Models
- {
- public class BarParent
- {
- public string[] labels
- {
- get;
- set;
- }
- public Bar[] datasets
- {
- get;
- set;
- }
- }
- public class Bar
- {
- public string label
- {
- get;
- set;
- }
- public string fillColor
- {
- get;
- set;
- }
- public string strokeColor
- {
- get;
- set;
- }
- public string highlightFill
- {
- get;
- set;
- }
- public string highlightStroke
- {
- get;
- set;
- }
- public int[] data
- {
- get;
- set;
- }
- }
- }
Add “BarChartcontroller” class under the folder Controllers and set the inline data source.
- using System;
- using System.Collections.Generic;
- using System.Linq;
- using System.Net;
- using System.Net.Http;
- using System.Web.Http;
- using AngularJS_ChartsAndGraphs.Models;
- namespace AngularJS_ChartsAndGraphs.Controllers
- {
- public class BarChartController: ApiController
- {
- public BarParentGetData()
- {
- BarParent barParent = new BarParent();
- Bar[] objBar = newBar[2];
- Bar bar = new Bar();
- bar.label = "First datasource";
- bar.fillColor = "rgba(221,221,221,0.6)";
- bar.strokeColor = "rgba(221,221,221,0.9)";
- bar.highlightFill = "rgba(221,221,221,0.76)";
- bar.highlightStroke = "rgba(221,221,221,2)";
- bar.data = newint[7]
- {
- 64,58,79,80, 55,54,39
- };
- Bar bar1 = newBar();
- bar1.label = "Second datasource";
- bar1.fillColor = "rgba(152,188,206,0.6)";
- bar1.strokeColor = "rgba(152,188,206,0.9)";
- bar1.highlightFill = "rgba(152,188,206,0.76)";
- bar1.highlightStroke = "rgba(152,188,206,2)";
- bar1.data = newint[7]
- {
- 27,47, 39,18,85,26,89
- };
- objBar = newBar[2]
- {
- bar,
- bar1
- };
- barParent.datasets = objBar;
- barParent.labels = newstring[7]
- {
- "Sunday", "Monday","Tuesday","Wednesday","Thursday","Friday","Saturday"
- };
- return barParent;
- }
- }
- }
Add a JS file and name it as bar.js, in this file we are making service call to get the required data source and setting the options as per our need.
- 'use strict';
- angular
- .module('app.bar', [])
- .controller('BarCtrl', function($scope, $http) {
- $http.get('http://localhost:54796/API/BarChart').
- success(function(data, status, headers, config) {
- $scope.data = data;
- }).
- error(function(data, status, headers, config) {
- $scope.danger("Service call failed!");
- });
- $scope.options = {
- ///Set the responsive option either true or false
- responsive: true,
- /// Set the scaleBeginAtZero option either true or false, if true then the scale should start at zeroor the order of the magnitude will down from the lowest value
- scaleBeginAtZero: true,
- ///This option decides whether grid lines will be shown in the chart or not
- scaleShowGridLines: true,
- /// Set the color for the grid lines
- scaleGridLineColor: "rgba(0,0,0,.06)",
- /// Set the width of the grid lines in number
- scaleGridLineWidth: 2,
- /// Set the barShowStroke, if you set as true then there will be a stroke on each bar and if you set as false then there will be no stroke on each bar
- barShowStroke: true,
- /// Set the width of the bar stroke in number
- barStrokeWidth: 3,
- /// Set the space between each Y value sets
- barValueSpacing: 6,
- /// Set the space between data sets within Y values
- barDatasetSpacing: 2,
- /// Customize your legend
- legendTemplate: '<ul class="tc-chart-js-legend"><% for (vari=0; i<datasets.length; i++){%><li><span style="background-color:<%=datasets[i].fillColor%>"></span>
- <%if(datasets[i].label){%>
- <%=datasets[i].label%>
- <%}%> < /li><%}%></ul > ' };});
Add a HTML file under “/AngularJS_ChartsAndGraphs/App/demo/bar/” folder and name it index.html.
Add the scripts reference in your HTML page,
- <script src="../js/thirdpartyJS/Jquery.js"></script>
- <script src="../js/thirdpartyJS/foundation.min.js"></script>
- <script src="../js/thirdpartyJS/angular.js"></script>
- <script src="../js/thirdpartyJS/Chart.js"></script>
- <script src="../js/thirdpartyJS/tc-angular-chartjs.js"></script>
- <script src="../js/app.js"></script>
- <script src="../js/bar.js"></script>
- <link rel="stylesheet"href="../css/foundation.min.css">
- <link rel="stylesheet"href="../css/font-awesome.min.css">
- <link rel="stylesheet"href="../css/app.css">
- <!DOCTYPE html>
- <html data-ng-app="app">
- <head>
- <meta charset="utf-8">
- <meta name="viewport"content="width=device-width, initial-scale=1.0">
- <title>Bar Chart - AngularJS</title>
- <!-- HEAD -->
- <link rel="stylesheet"href="../css/foundation.min.css">
- <link rel="stylesheet"href="../css/font-awesome.min.css">
- <link rel="stylesheet"href="../css/app.css">
- <!-- END HEAD -->
- </head>
- <body>
- <!-- TOP BAR -->
- <div class="contain-to-grid fixed">
- <nav class="top-bar"data-topbarrole="navigation">
- <ul class="title-area">
- <li class="toggle-topbar menu-icon">
- <a href="#">
- <span>Menu</span>
- </a>
- </li>
- </ul>
- <section class="top-bar-section">
- <ul class="left">
- <li class="active">
- <a href="../bar/index.html">Bar
- </a>
- </li>
- <li class="divider">
- </li>
- </ul>
- </section>
- </nav>
- </div>
- <!-- END TOP BAR -->
- <!-- CONTENT -->
- <div class="row"ng-controller="BarCtrl"style="margin-top:20px;">
- <div class="large-12 columns">
- <h1>Bar Chart</h1>
- <hr>
- </div>
- <div class="medium-8 columns">
- <canvas tc-chartjs-barchart-options="options"chart-data="data"chart-legend="barChart1">
- </canvas>
- </div>
- <div class="medium-4 columns">
- <div tc-chartjs-legendchart-legend="barChart1">
- </div>
- </div>
- </div>
- <!-- END CONTENT -->
- <!-- SCRIPTS -->
- <script src="../js/thirdpartyJS/Jquery.js">
- </script>
- <script src="../js/thirdpartyJS/foundation.min.js">
- </script>
- <script src="../js/thirdpartyJS/angular.js">
- </script>
- <script src="../js/thirdpartyJS/Chart.js">
- </script>
- <script src="../js/thirdpartyJS/tc-angular-chartjs.js">
- </script>
- <script src="../js/app.js">
- </script>
- <script src="../js/bar.js">
- </script>
- <script>
- $(document).foundation();
- </script>
- <!-- END SCRIPTS -->
- </body>
- </html>
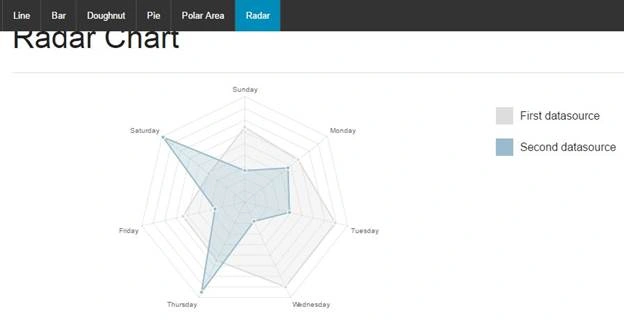
Radar Chart
Add a model class
A model is a class which defines a data structure.
In Solution Explorer, Right-click on Model folder. And from the context menu, choose Add > Class.
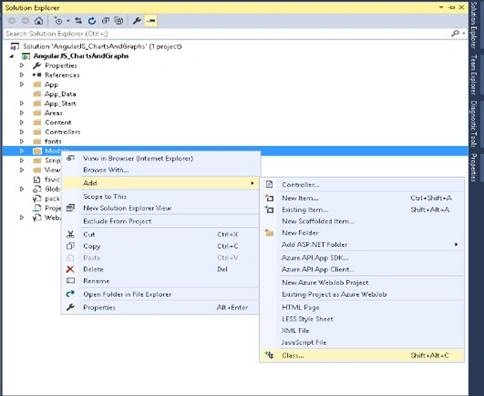
Add a model class Radar.cs under Model folder.
- using System;
- using System.Collections.Generic;
- using System.Linq;
- using System.Web;
- namespace AngularJS_ChartsAndGraphs.Models
- {
- public class RadarParent
- {
- public string[] labels
- {
- get;
- set;
- }
- public Radar[] datasets
- {
- get;
- set;
- }
- }
- public class Radar
- {
- public string label
- {
- get;
- set;
- }
- public string fillColor
- {
- get;
- set;
- }
- public string strokeColor
- {
- get;
- set;
- }
- public string pointColor
- {
- get;
- set;
- }
- public string pointStrokeColor
- {
- get;
- set;
- }
- public string pointHighlightFill
- {
- get;
- set;
- }
- public string pointHighlightStroke
- {
- get;
- set;
- }
- public int[] data
- {
- get;
- set;
- }
- }
- }
Add a “RadarChartcontroller” class under the folder Controllers and set the inline data source.
- using AngularJS_ChartsAndGraphs.Models;
- using System;
- using System.Collections.Generic;
- using System.Linq;
- using System.Net;
- using System.Net.Http;
- using System.Web.Http;
- namespace AngularJS_ChartsAndGraphs.Controllers
- {
- public class RadarChartController: ApiController
- {
- public RadarParentGetData()
- {
- RadarParentradarParent = newRadarParent();
- Radar[] objRadar = newRadar[2];
- Radarradar = newRadar();
- radar.label = "First datasource";
- radar.fillColor = "rgba(221,221,221,0.3)";
- radar.strokeColor = "rgba(221,221,221,2)";
- radar.pointColor = "rgba(221,221,221,2)";
- radar.pointStrokeColor = "#fff";
- radar.pointHighlightFill = "#fff";
- radar.pointHighlightStroke = "rgba(221,221,221,2)";
- radar.data = newint[7]
- {
- 64,58,79,80,55, 54,39
- };
- Radar radar1 = newRadar();
- radar1.label = "Second datasource";
- radar1.fillColor = "rgba(152,188,206,0.3)";
- radar1.strokeColor = "rgba(152,188,206,3)";
- radar1.pointColor = "rgba(152,188,206,3)";
- radar1.pointStrokeColor = "#fff";
- radar1.pointHighlightFill = "#fff";
- radar1.pointHighlightStroke = "rgba(152,188,206,3)";
- radar1.data = newint[7]
- {
- 27,47,39,18,85,26,89
- };
- objRadar = newRadar[2]
- {
- radar,
- radar1
- };
- radarParent.datasets = objRadar;
- radarParent.labels = newstring[7]
- {
- "Sunday","Monday","Tuesday","Wednesday","Thursday","Friday", "Saturday"
- };
- return radarParent;
- }
- }
- }
Add a JS file and name it as radar.js, in this file we are making service call to get the required data source and setting the options as per our need.
- 'use strict';
- angular
- .module('app.radar', [])
- .controller('RadarCtrl', function($scope, $http) {
- $http.get('http://localhost:54796/API/RadarChart').
- success(function(data, status, headers, config) {
- $scope.data = data;
- }).
- error(function(data, status, headers, config) {
- $scope.danger("Service call failed!");
- });
- $scope.options = {
- ///Set the responsive option either true or false
- responsive: true,
- /// Set the scaleShowLineattribute to either true or false, if you set as true then lines will be visible for each scale point and if you set as false then lines will not visible for each scale point
- scaleShowLine: true,
- /// Set the angleShowLineOut attribute either to true or false, if you set as true then the angle lines will be visible out of the radar and if you set as false then the angle lines will not be visible out of the radar
- angleShowLineOut: true,
- /// This attribute decides whether the labels of the scale will be visible or not
- scaleShowLabels: false,
- ///This attribute decides whether the scale should begin at zero or not
- scaleBeginAtZero: true,
- /// Set the color of the angle line
- angleLineColor: 'rgba(0,0,0,.2)',
- /// Set the pixel width in number for the angle line
- angleLineWidth: 1,
- /// Set the font style for point label declaration
- pointLabelFontFamily: '"Calibri"',
- /// Set the font weight for point label
- pointLabelFontStyle: 'normal',
- /// Set the font size for point label in pixels
- pointLabelFontSize: 12,
- /// Set the font color for point label
- pointLabelFontColor: '#666',
- /// This attribute decides whether to show a dot for each point
- pointDot: true,
- /// Set this attribute in pixels to set the radius of each point dot
- pointDotRadius: 2,
- /// Set the attribute in number to set the width of point dot stroke
- pointDotStrokeWidth: 2,
- /// Set this option in number to set the radius which hit detection outside the drawn point
- pointHitDetectionRadius: 19,
- /// Set this attribute to set it’s visibility of a stroke for datasets
- datasetStroke: true,
- /// Set the width of a dataset stroke in pixels
- datasetStrokeWidth: 3,
- /// This attribute decides whether to fill dataset with color or not
- datasetFill: true,
- /// Customize your legend
- legendTemplate: '<ul class="tc-chart-js-legend"><% for (vari=0; i<datasets.length; i++){%><li><span style="background-color:<%=datasets[i].strokeColor%>"></span>
- <%if(datasets[i].label){%>
- <%=datasets[i].label%>
- <%}%> < /li><%}%></ul > ' };});
Add the scripts reference in your HTML page
- <script src="../js/thirdpartyJS/Jquery.js"></script>
- <script src="../js/thirdpartyJS/foundation.min.js"></script>
- <script src="../js/thirdpartyJS/angular.js"></script>
- <script src="../js/thirdpartyJS/Chart.js"></script>
- <script src="../js/thirdpartyJS/tc-angular-chartjs.js"></script>
- <script src="../js/app.js"></script>
- <script src="../js/radar.js"></script>
- <link rel="stylesheet"href="../css/foundation.min.css">
- <link rel="stylesheet"href="../css/font-awesome.min.css">
- <link rel="stylesheet"href="../css/app.css">
- <!DOCTYPE html>
- <html data-ng-apphtmldata-ng-app="app">
- <head>
- <meta charset="utf-8">
- <meta name="viewport"content="width=device-width, initial-scale=1.0">
- <title>Radar Chart - AngularJS</title>
- <!-- HEAD -->
- <link rel="stylesheet"href="../css/foundation.min.css">
- <link rel="stylesheet"href="../css/font-awesome.min.css">
- <link rel="stylesheet"href="../css/app.css">
- <!-- END HEAD -->
- </head>
- <body>
- <!-- TOP BAR -->
- <div class="contain-to-grid fixed">
- <nav class="top-bar"data-topbarrole="navigation">
- <ul class="title-area">
- <li class="toggle-topbar menu-icon">
- <a href="#">
- <span>Menu</span>
- </a>
- </li>
- </ul>
- <section class="top-bar-section">
- <ul class="left">
- <li class="active">
- <ahref="">Radar
- </a>
- </li>
- <li class="divider">
- </li>
- </ul>
- </section>
- </nav>
- </div>
- <!-- END TOP BAR -->
- <!-- CONTENT -->
- <div class="row"ng-controller="RadarCtrl"style="margin-top:20px;">
- <div class="large-12 columns">
- <h1>Radar Chart</h1>
- <hr>
- </div>
- <divclass="medium-8 columns">
- <canvas tc-chartjs-radarchart-optionscanvastc-chartjs-radarchart-options="options"chart-data="data"chart-legend="radarChart1">
- </canvas>
- </div>
- <div class="medium-4 columns">
- <div tc-chartjs-legendchart-legenddivtc-chartjs-legendchart-legend="radarChart1">
- </div>
- </div>
- </div>
- <!-- END CONTENT -->
- <!-- SCRIPTS -->
- <script src="../js/thirdpartyJS/Jquery.js">
- </script>
- <script src="../js/thirdpartyJS/foundation.min.js">
- </script>
- <script src="../js/thirdpartyJS/angular.js">
- </script>
- <script src="../js/thirdpartyJS/Chart.js">
- </script>
- <script src="../js/thirdpartyJS/tc-angular-chartjs.js">
- </script>
- <script src="../js/app.js">
- </script>
- <script src="../js/radar.js">
- </script>
- <script>
- $(document).foundation();
- </script>
- <!-- END SCRIPTS -->
- </body>
- </html>
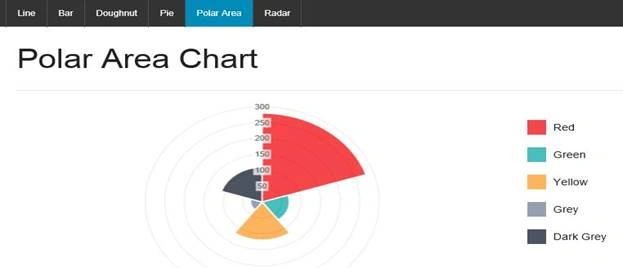
Polar Area Chart
Add a model class
A model is a class which defines a data structure.
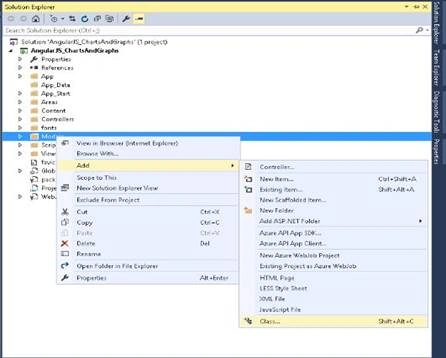
In Solution Explorer, Right-click on Model folder. And from the context menu, choose Add > Class.
Add a model class Polar.cs under Model folder.
- using System;
- using System.Collections.Generic;
- using System.Linq;
- using System.Web;
- namespace AngularJS_ChartsAndGraphs.Models
- {
- public class Polar
- {
- public int value
- {
- get;
- set;
- }
- public string color
- {
- get;
- set;
- }
- public string highlight
- {
- get;
- set;
- }
- public string label
- {
- get;
- set;
- }
- }
- }
Add a “PolarChartcontroller” class under the Controllers folder and set the inline data source.
- using AngularJS_ChartsAndGraphs.Models;
- using System;
- using System.Collections.Generic;
- using System.Linq;
- using System.Net;
- using System.Net.Http;
- using System.Web.Http;
- namespace AngularJS_ChartsAndGraphs.Controllers
- {
- public class PolarChartController: ApiController
- {
- public List < Polar > GetData()
- {
- List < Polar > polarParent = newList < Polar > ();
- Polar polar = newPolar();
- polar.value = 280;
- polar.color = "#F7464A";
- polar.highlight = "#FF5A5E";
- polar.label = "Red";
- Polar polar1 = newPolar();
- polar1.value = 70;
- polar1.color = "#46BFBD";
- polar1.highlight = "#5AD3D1";
- polar1.label = "Green";
- Polar polar2 = newPolar();
- polar2.value = 120;
- polar2.color = "#FDB45C";
- polar2.highlight = "#FFC870";
- polar2.label = "Yellow";
- Polar polar3 = newPolar();
- polar3.value = 30;
- polar3.color = "#949FB1";
- polar3.highlight = "#A8B3C5";
- polar3.label = "Grey";
- Polar polar4 = newPolar();
- polar4.value = 110;
- polar4.color = "#4D5360";
- polar4.highlight = "#616774";
- polar4.label = "Dark Grey";
- polarParent.Add(polar);
- polarParent.Add(polar1);
- polarParent.Add(polar2);
- polarParent.Add(polar3);
- polarParent.Add(polar4);
- return polarParent;
- }
- }
- }
Add a JS file and name it as polararea.js, in the file we are making service call to get the required data source and setting the options as per our need.
- 'use strict';
- angular
- .module('app.polararea', [])
- .controller('PolarareaCtrl', function($scope, $http) {
- $http.get('http://localhost:54796/API/PolarChart').
- success(function(data, status, headers, config) {
- $scope.data = data;
- }).
- error(function(data, status, headers, config) {
- $scope.danger("Service call failed!");
- });
- $scope.options = {
- ///Set the responsive option either true or false
- responsive: true,
- /// Set this option to true to visible backdrop on the scale level
- scaleShowLabelBackdrop: true,
- /// Set the color of the backdrop label
- scaleBackdropColor: 'rgba(255,255,255,0.65)',
- ///Set the scale position to true to set it position to zero
- scaleBeginAtZero: true,
- ///Set the backdrop scale paddingin number for Y axis
- scaleBackdropPaddingY: 3,
- /// Set the backdrop scale padding in number for X axis
- scaleBackdropPaddingX: 3,
- /// Set the option to true to show line for each value in the scale
- scaleShowLine: true,
- /// Set the option to true to show stroke line for each segment in the chart
- segmentShowStroke: true,
- /// Set the color for each stroke line for each segment in the chart
- segmentStrokeColor: '#fff',
- /// Set the width in number for each stroke segment
- segmentStrokeWidth: 3,
- /// Set the value for animation steps in number
- animationSteps: 99,
- /// Set animation easing effect.
- animationEasing: 'easeOutBounce',
- /// Set the option to animate the rotation of the chart
- animateRotate: true,
- /// Set the option to animate scaling the chart
- animateScale: false,
- /// Customize the legend title
- legendTemplate: '<ul class="tc-chart-js-legend"><% for (vari=0; i<segments.length; i++){%><li><span style="background-color:<%=segments[i].fillColor%>"></span>
- <%if(segments[i].label){%>
- <%=segments[i].label%>
- <%}%> < /li><%}%></ul > '};});
Add the scripts reference in your HTML page,
- <script src="../js/thirdpartyJS/Jquery.js"></script>
- <script src="../js/thirdpartyJS/foundation.min.js"></script>
- <script src="../js/thirdpartyJS/angular.js"></script>
- <script src="../js/thirdpartyJS/Chart.js"></script>
- <script src="../js/thirdpartyJS/tc-angular-chartjs.js"></script>
- <script src="../js/app.js"></script>
- <script src="../js/polararea.js"></script>
- <link rel="stylesheet"href="../css/foundation.min.css">
- <link rel="stylesheet"href="../css/font-awesome.min.css">
- <link rel="stylesheet"href="../css/app.css">
- <!DOCTYPE html>
- <html data-ng-app="app">
- <head>
- <meta charset="utf-8">
- <meta name="viewport"content="width=device-width, initial-scale=1.0">
- <title>Polar Area Chart - AngularJS</title>
- <!-- HEAD -->
- <link rel="stylesheet"href="../css/foundation.min.css">
- <link rel="stylesheet"href="../css/font-awesome.min.css">
- <link rel="stylesheet"href="../css/app.css">
- <!-- END HEAD -->
- </head>
- <body>
- <!-- TOP BAR -->
- <div class="contain-to-grid fixed">
- <nav class="top-bar" data-topbar role="navigation">
- <ul class="title-area">
- <li class="toggle-topbar menu-icon">
- <a href="#">
- <span>Menu</span>
- </a>
- </li>
- </ul>
- <section class="top-bar-section">
- <ul class="left">
- <li class="active">
- <a href="">Polar Area
- </a>
- </li>
- <li class="divider">
- </li>
- </ul>
- </section>
- </nav>
- </div>
- <!-- END TOP BAR -->
- <!-- CONTENT -->
- <div class="row"ng-controller="PolarareaCtrl"style="margin-top:20px;">
- <div class="large-12 columns">
- <h1>Polar Area Chart</h1>
- <hr>
- </div>
- <div class="medium-8 columns">
- <canvastc-chartjs-polarareachart-optionscanvastc-chartjs-polarareachart-options="options"chart-data="data"chart-legend="polarareaChart1">
- </canvas>
- </div>
- <div class="medium-4 columns">
- <div tc-chartjs-legendchart-legenddivtc-chartjs-legendchart-legend="polarareaChart1">
- </div>
- </div>
- </div>
- <!-- END CONTENT -->
- <!-- SCRIPTS -->
- <script src="../js/thirdpartyJS/Jquery.js">
- </script>
- <script src="../js/thirdpartyJS/foundation.min.js">
- </script>
- <script src="../js/thirdpartyJS/angular.js">
- </script>
- <script src="../js/thirdpartyJS/Chart.js">
- </script>
- <script src="../js/thirdpartyJS/tc-angular-chartjs.js">
- </script>
- <script src="../js/app.js">
- </script>
- <script src="../js/polararea.js">
- </script>
- <script>
- $(document).foundation();
- </script>
- <!-- END SCRIPTS -->
- </body>
- </html>
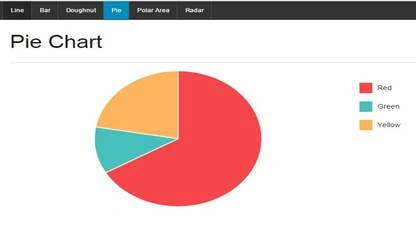
Pie Chart
Add a model class
A model is a class which defines a data structure.
In Solution Explorer, Right-click on Model folder. And from the context menu, choose Add > Class.
Add a model class “Pie.cs“under Model folder.
- using System;
- using System.Collections.Generic;
- using System.Linq;
- using System.Web;
- namespace AngularJS_ChartsAndGraphs.Models
- {
- public class Pie
- {
- publicint value
- {
- get;
- set;
- }
- public string color
- {
- get;
- set;
- }
- public string highlight
- {
- get;
- set;
- }
- public string label
- {
- get;
- set;
- }
- }
- }
Add a “PieChartcontroller” class under the folder Controllers and set the inline data source.
- using System;
- using System.Collections.Generic;
- using System.Linq;
- using System.Net;
- using System.Net.Http;
- using System.Web.Http;
- using AngularJS_ChartsAndGraphs.Models;
- namespaceAngularJS_ChartsAndGraphs.Controllers
- {
- public class PieChartController: ApiController
- {
- public List < Pie > GetData()
- {
- List < Pie > pieParent = new List < Pie > ();
- Pie pie = new Pie();
- pie.value = 300;
- pie.color = "#F7464A";
- pie.highlight = "#FF5A5E";
- pie.label = "Red";
- Pie pie1 = newPie();
- pie1.value = 50;
- pie1.color = "#46BFBD";
- pie1.highlight = "#5AD3D1";
- pie1.label = "Green";
- Pie pie2 = newPie();
- pie2.value = 100;
- pie2.color = "#FDB45C";
- pie2.highlight = "#FFC870";
- pie2.label = "Yellow";
- pieParent.Add(pie);
- pieParent.Add(pie1);
- pieParent.Add(pie2);
- return pieParent;
- }
- }
- }
Add a JS file and name it as “pie.js”, in this file we are making service call to get the required data source and setting the options as per our need.
- 'use strict';
- angular
- .module('app.pie', [])
- .controller('PieCtrl', function($scope, $http) {
- $http.get('http://localhost:54796/API/PieChart').
- success(function(data, status, headers, config) {
- $scope.data = data;
- }).
- error(function(data, status, headers, config) {
- $scope.danger("Service call failed!");
- });
- $scope.options = {
- ///Set the responsive option either true or false
- responsive: true,
- /// Set the option to true to show stroke line for each segment in the chart
- segmentShowStroke: true,
- /// Set the color for each stroke line for each segment in the chart
- segmentStrokeColor: '#fff',
- /// Set the width in number for each stroke segment
- segmentStrokeWidth: 3,
- /// Set this option in number such that the percentage will cut of in the middle of the chart
- percentageInnerCutout: 1, // This is 0 for Pie charts
- /// Set the value for animation steps in number
- animationSteps: 99,
- /// Set the option to animation easing effect
- animationEasing: 'easeOutBounce',
- /// Set the option to animate the rotation of the chart
- animateRotate: true,
- /// Set the option to animate scaling the chart
- animateScale: false,
- /// Customize the legend title
- legendTemplate: '<ul class="tc-chart-js-legend"><% for (vari=0; i<segments.length; i++){%><li><span style="background-color:<%=segments[i].fillColor%>"></span>
- <%if(segments[i].label){%>
- <%=segments[i].label%>
- <%}%> < /li><%}%></ul > '};});
Add the scripts reference in your HTML page
- <script src="../js/thirdpartyJS/Jquery.js"></script>
- <script src="../js/thirdpartyJS/foundation.min.js"></script>
- <script src="../js/thirdpartyJS/angular.js"></script>
- <script src="../js/thirdpartyJS/Chart.js"></script>
- <script src="../js/thirdpartyJS/tc-angular-chartjs.js"></script>
- <script src="../js/app.js"></script>
- <script src="../js/pie.js"></script>
- <link rel="stylesheet"href="../css/foundation.min.css">
- <link rel="stylesheet"href="../css/font-awesome.min.css">
- <link rel="stylesheet"href="../css/app.css">
- <!DOCTYPEhtml>
- <html data-ng-app="app">
- <head>
- <meta charset="utf-8">
- <meta name="viewport"content="width=device-width, initial-scale=1.0">
- <title>Pie Chart - AngularJS</title>
- <!-- HEAD -->
- <link rel="stylesheet"href="../css/foundation.min.css">
- <link rel="stylesheet"href="../css/font-awesome.min.css">
- <link rel="stylesheet"href="../css/app.css">
- <!-- END HEAD -->
- </head>
- <body>
- <!-- TOP BAR -->
- <div class="contain-to-grid fixed">
- <nav class="top-bar"data-topbarrole="navigation">
- <ul class="title-area">
- <li class="toggle-topbar menu-icon">
- <a href="#">
- <span>Menu</span>
- </a>
- </li>
- </ul>
- <section class="top-bar-section">
- <ul class="left">
- <li class="active">
- <a href="">Pie
- </a>
- </li>
- <li class="divider">
- </li>
- </ul>
- </section>
- </nav>
- </div>
- <!-- END TOP BAR -->
- <!-- CONTENT -->
- <div class="row"ng-controller="PieCtrl"style="margin-top:20px;">
- <div class="large-12 columns">
- <h1>Pie Chart</h1>
- <hr>
- </div>
- <div class="medium-8 columns">
- <canvas tc-chartjs-piechart-optionscanvastc-chartjs-piechart-options="options"chart-data="data"chart-legend="pieChart1">
- </canvas>
- </div>
- <div class="medium-4 columns">
- <divtc-chartjs-legendchart-legenddivtc-chartjs-legendchart-legend="pieChart1">
- </div>
- </div>
- </div>
- <!-- END CONTENT -->
- <!-- SCRIPTS -->
- <script src="../js/thirdpartyJS/Jquery.js">
- </script>
- <script src="../js/thirdpartyJS/foundation.min.js">
- </script>
- <script src="../js/thirdpartyJS/angular.js">
- </script>
- <script src="../js/thirdpartyJS/Chart.js">
- </script>
- <script src="../js/thirdpartyJS/tc-angular-chartjs.js">
- </script>
- <script src="../js/app.js">
- </script>
- <script src="../js/pie.js">
- </script>
- <script>
- $(document).foundation();
- </script>
- <!-- END SCRIPTS -->
- </body>
- </html>
Doughnut Chart
Add a model class
A model is a class which defines a data structure.
In Solution Explorer, Right-click on Model folder. And from the context menu, choose Add > Class.
Add a model class “Doughnut.cs“ under Model folder.
- using System;
- using System.Collections.Generic;
- using System.Linq;
- using System.Web;
- namespace AngularJS_ChartsAndGraphs.Models
- {
- public class Doughnut
- {
- public int value
- {
- get;
- set;
- }
- public string color
- {
- get;
- set;
- }
- public string highlight
- {
- get;
- set;
- }
- public string label
- {
- get;
- set;
- }
- }
- }
Add a “DoughnutChartcontroller” class under the folder Controllers and set the inline data source.
- using AngularJS_ChartsAndGraphs.Models;
- using System;
- using System.Collections.Generic;
- using System.Linq;
- using System.Net;
- using System.Net.Http;
- using System.Web.Http;
- namespace AngularJS_ChartsAndGraphs.Controllers
- {
- public class DoughnutChartController: ApiController
- {
- public List < Doughnut > GetData()
- {
- List < Doughnut > doughnutParent = newList < Doughnut > ();
- Doughnut doughnut = new Doughnut();
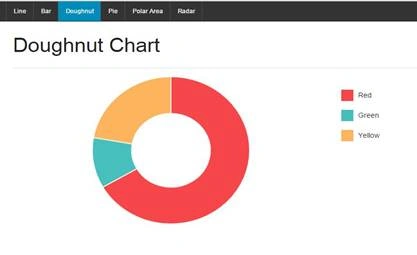
- doughnut.value = 300;
- doughnut.color = "#F7464A";
- doughnut.highlight = "#FF5A5E";
- doughnut.label = "Red";
- Doughnut doughnut1 = newDoughnut();
- doughnut1.value = 50;
- doughnut1.color = "#46BFBD";
- doughnut1.highlight = "#5AD3D1";
- doughnut1.label = "Green";
- Doughnut doughnut2 = newDoughnut();
- doughnut2.value = 100;
- doughnut2.color = "#FDB45C";
- doughnut2.highlight = "#FFC870";
- doughnut2.label = "Yellow";
- doughnutParent.Add(doughnut);
- doughnutParent.Add(doughnut1);
- doughnutParent.Add(doughnut2);
- returndoughnutParent;
- }
- }
- }
Add a JS file and name it as doughnut.js, in this file we are making service call to get the required data source and setting the options as per our need.
- 'use strict';
- angular
- .module('app.doughnut', [])
- .controller('DoughnutCtrl', function($scope, $http) {
- $http.get('http://localhost:54796/API/DoughnutChart').
- success(function(data, status, headers, config) {
- $scope.data = data;
- }).
- error(function(data, status, headers, config) {
- $scope.danger("Service call failed!");
- });
- $scope.options = {
- ///Set the responsive option either true or false
- responsive: true,
- /// Set the option to true to show stroke line for each segment in the chart
- segmentShowStroke: true,
- /// Set the color for each stroke line for each segment in the chart
- segmentStrokeColor: '#fff',
- /// Set the width in number for each stroke segment
- segmentStrokeWidth: 3,
- /// Set this option in number such that the percentage will cut of in the middle of the chart
- percentageInnerCutout: 51, // This is 0 for Pie charts
- /// Set the value for animation steps in number
- animationSteps: 99,
- /// Set the option to animation easing effect
- animationEasing: 'easeOutBounce',
- /// Set the option to animate the rotation of the chart
- animateRotate: true,
- /// Set the option to animate scaling the chart
- animateScale: false,
- /// Customize the legend title
- legendTemplate: '<ul class="tc-chart-js-legend"><% for (vari=0; i<segments.length; i++){%><li><span style="background-color:<%=segments[i].fillColor%>"></span>
- <%if(segments[i].label){%>
- <%=segments[i].label%>
- <%}%> < /li><%}%></ul > ' }; });
Add the scripts reference in your HTML page
- <script src="../js/thirdpartyJS/Jquery.js">
- </script>
- <script src="../js/thirdpartyJS/foundation.min.js">
- </script>
- <script src="../js/thirdpartyJS/angular.js">
- </script>
- <script src="../js/thirdpartyJS/Chart.js">
- </script>
- <script src="../js/thirdpartyJS/tc-angular-chartjs.js">
- </script>
- <script src="../js/app.js">
- </script>
- <script src="../js/doughnut.js">
- </script>
- <link rel="stylesheet" href="../css/foundation.min.css">
- <link rel="stylesheet" href="../css/font-awesome.min.css">
- <link rel="stylesheet" href="../css/app.css">
- <!DOCTYPEhtml>
- <html data-ng-app="app">
- <head>
- <meta charset="utf-8">
- <meta name="viewport"content="width=device-width, initial-scale=1.0">
- <title>Doughnut Chart - AngularJS</title>
- <!-- HEAD -->
- <link rel="stylesheet"href="../css/foundation.min.css">
- <link rel="stylesheet"href="../css/font-awesome.min.css">
- <link rel="stylesheet"href="../css/app.css">
- <!-- END HEAD -->
- </head>
- <body>
- <!-- TOP BAR -->
- <div class="contain-to-grid fixed">
- <nav class="top-bar"data-topbar role="navigation">
- <ul class="title-area">
- <li class="toggle-topbar menu-icon">
- <a href="#">
- <span>Menu</span>
- </a>
- </li>
- </ul>
- <section class="top-bar-section">
- <ul class="left">
- <li class="active">
- <a href="">Doughnut
- </a>
- </li>
- <li class="divider">
- </li>
- </ul>
- </section>
- </nav>
- </div>
- <!-- END TOP BAR -->
- <!-- CONTENT -->
- <div class="row"ng-controller="DoughnutCtrl"style="margin-top:20px;">
- <div class="large-12 columns">
- <h1>Doughnut Chart</h1>
- <hr>
- </div>
- <div class="medium-8 columns">
- <canvastc-chartjs-doughnutchart-optionscanvastc-chartjs-doughnutchart-options="options"chart-data="data"chart-legend="doughnutChart1">
- </canvas>
- </div>
- <div class="medium-4 columns">
- <divtc-chartjs-legendchart-legenddivtc-chartjs-legendchart-legend="doughnutChart1">
- </div>
- </div>
- </div>
- <!-- END CONTENT -->
- <!-- SCRIPTS -->
- <script src="../js/thirdpartyJS/Jquery.js">
- </script>
- <script src="../js/thirdpartyJS/foundation.min.js">
- </script>
- <script src="../js/thirdpartyJS/angular.js">
- </script>
- <script src="../js/thirdpartyJS/Chart.js">
- </script>
- <script src="../js/thirdpartyJS/tc-angular-chartjs.js">
- </script>
- <script src="../js/app.js">
- </script>
- <script src="../js/doughnut.js">
- </script>
- <script>
- $(document).foundation();
- </script>
- <!-- END SCRIPTS -->
- </body>
- </html>
Note - In this article, few commands or syntax which I have used may match from online.
Santosh Kumar AdidawarpuPosted May 11, 2016, 5:16 AM
Thanks everyone...
Pankaj Kumar ChoudharyPosted May 11, 2016, 4:55 AM
Great Efforts..........
Nilesh JoshiPosted May 7, 2016, 7:05 PM
hell of an article, Keep it up !
Sr KarthigaPosted May 6, 2016, 9:01 PM
good one
Vignesh ManiPosted May 6, 2016, 5:00 PM
Nice
Kuppurasu NagarajPosted May 6, 2016, 9:08 AM
Nice Sharing..
Vivek KumarPosted May 6, 2016, 8:50 AM
Nice share
Sonu ChaudharyPosted May 6, 2016, 8:17 AM
Really nice one