

Introduction
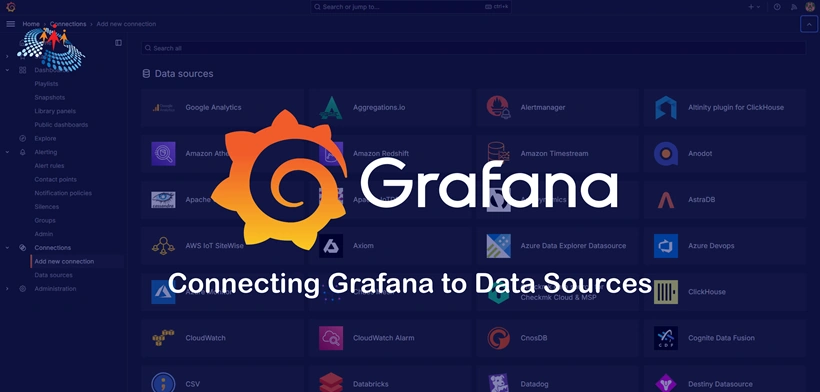
Grafana is a powerful tool for visualizing and monitoring data from various sources. To leverage its capabilities fully, you need to connect Grafana to your data sources. This article will guide you through the process of connecting Grafana to databases, APIs, and other data sources, enabling you to create insightful dashboards and visualizations.
Connecting Grafana to Databases
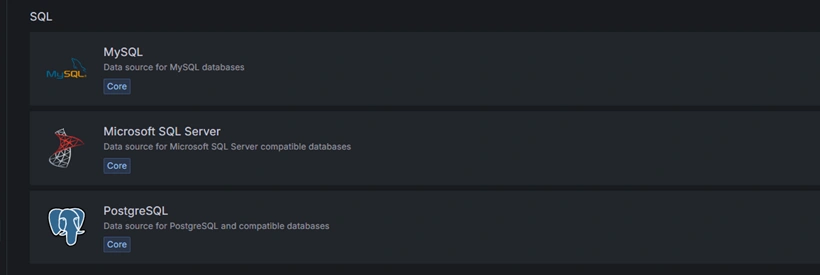
- Relational Databases: MySQL, PostgreSQL, Microsoft SQL Server, SQLite – These powerhouses hold your structured data, and Grafana seamlessly integrates with them, enabling you to visualize trends and patterns.
-
MySQL: To connect Grafana to a MySQL database, you first need to install the MySQL data source plugin. Once installed, you can configure the plugin by providing the necessary connection details such as host, port, database name, username, and password. Grafana will then establish a connection to your MySQL database, allowing you to query and visualize your data.
-
PostgreSQL: Connecting Grafana to a PostgreSQL database is similar to MySQL. Install the PostgreSQL data source plugin, and configure it with the database connection details. Grafana will then be able to retrieve data from your PostgreSQL database and display it in your dashboards
-
Microsoft SQL Server: To connect Grafana to a Microsoft SQL Server database, you can use the Microsoft SQL Server data source plugin. After installing the plugin, configure it with the SQL Server connection details, and Grafana will be able to retrieve data from your SQL Server database for visualization.
-
-
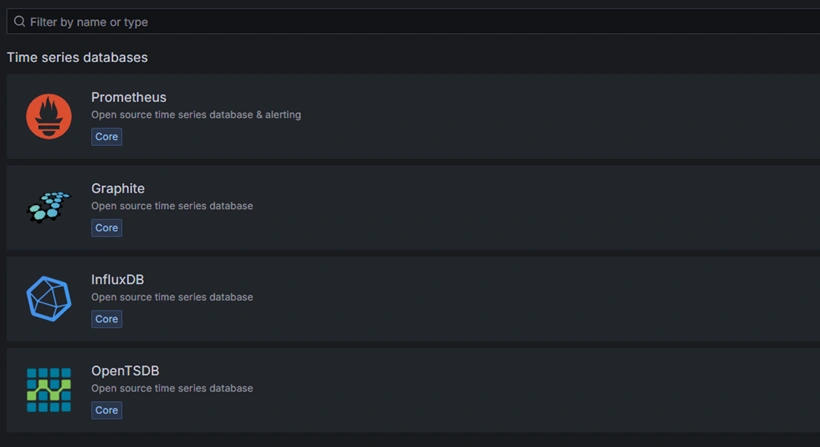
Time-Series Databases: Prometheus, InfluxDB – Optimized for storing temporal data points, these databases are perfect for visualizing metrics and sensor readings over time.
-
InfluxDB: InfluxDB is commonly used for storing time-series data, and Grafana has built-in support for InfluxDB. You can easily connect Grafana to InfluxDB by specifying the InfluxDB database details in the Grafana data source settings. This enables you to create time-series visualizations and monitor your data in real-time.
-
-
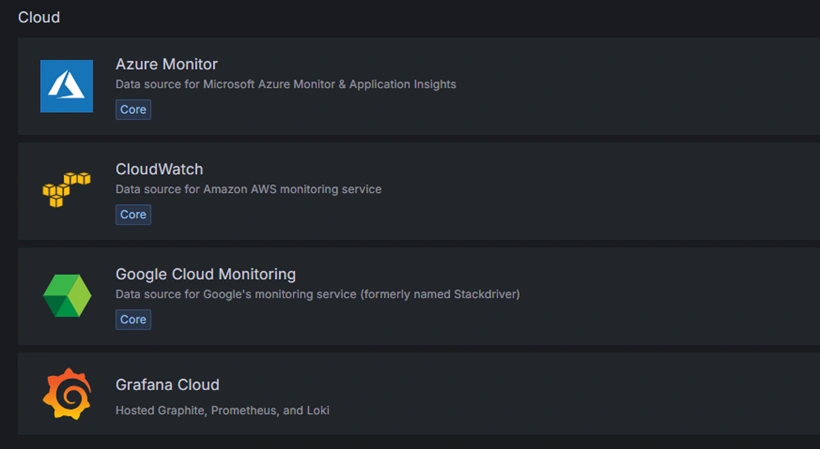
Cloud Platforms: Amazon CloudWatch, Microsoft Azure Monitor – If your data resides in the cloud, Grafana bridges the gap, allowing you to visualize metrics directly from your cloud provider's monitoring service.
Expanding Horizons with Data Source Plugins
The built-in options are a great starting point, but Grafana's plugin architecture takes it a step further. A thriving community of developers has created a vast ecosystem of data source plugins, extending support to an even wider range of data sources. Here's where you can find plugins for:
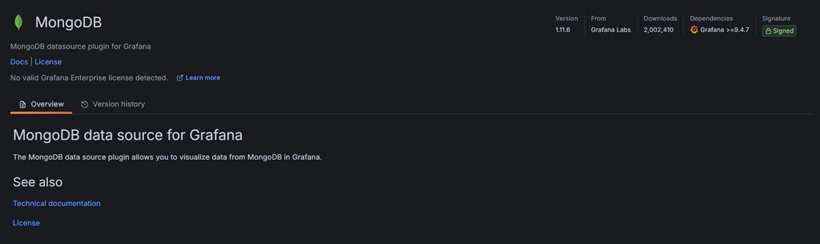
- NoSQL Databases: MongoDB, Cassandra – These giants handle massive volumes of unstructured data, and plugins enable Grafana to visualize their valuable insights.
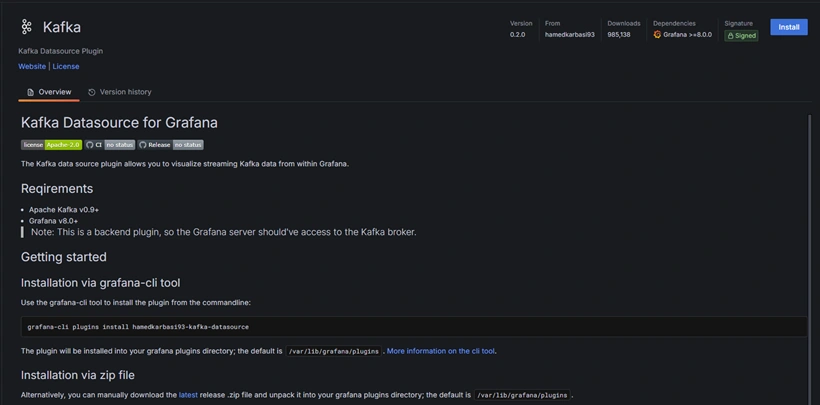
- Messaging Systems: Kafka, RabbitMQ – For applications that rely on real-time communication, plugins bridge the gap, allowing you to visualize message flows and identify bottlenecks.
- APIs: With the right plugin, you can tap into the treasure trove of data exposed by various APIs, enriching your visualizations with external data sources.
-
REST API: Grafana supports connecting to REST APIs to fetch data for visualization. You can use the Grafana Simple JSON data source plugin to connect to a REST API. Configure the plugin with the API endpoint URL and any required authentication details, and Grafana will fetch data from the API for visualization.
-
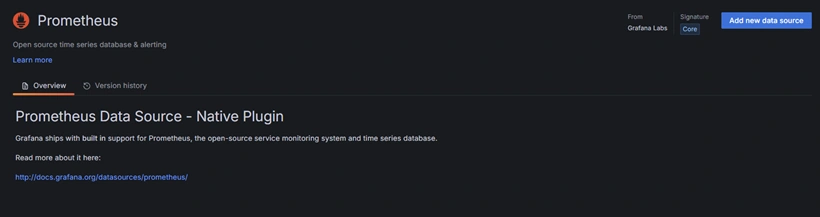
Prometheus API: If you're using Prometheus for monitoring, you can connect Grafana to the Prometheus API to retrieve metrics data. Grafana has built-in support for Prometheus, making it easy to create dashboards that visualize your Prometheus metrics.
-
Connecting Grafana to Other Data Sources
-
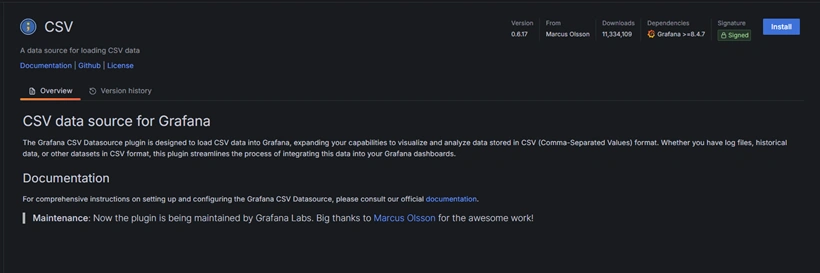
CSV Data Source: Grafana can also connect to CSV files to visualize data stored in CSV format. Use the Grafana CSV data source plugin to specify the path to your CSV file, and Grafana will import the data for visualization.
-
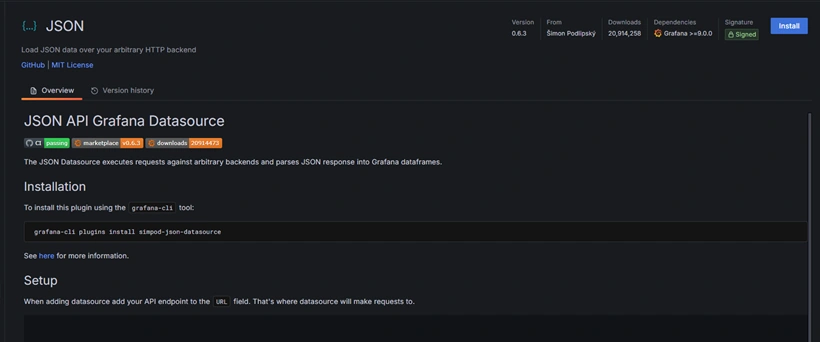
JSON Data Source: Similarly, Grafana can connect to JSON files using the Grafana JSON data source plugin. Configure the plugin with the path to your JSON file, and Grafana will import and visualize the JSON data.
Connecting to Your Data Source
The process of connecting Grafana to a data source is generally straightforward. Here's a simplified breakdown:
- Navigate to the Configuration Menu: Within Grafana, locate the configuration section, which typically involves user settings or server administration.
- Access Data Sources: Find the data source management area. This might be labelled "Data Sources" or "Configuration."
- Select the Data Source Type: Choose the appropriate data source from the available options, whether built-in or a plugin.
- Provide Connection Details: Fill in the necessary connection details, typically including server addresses, credentials, and database names (if applicable).
- Save and Test: Once configured, save the data source and perform a test connection to ensure successful communication.
Advanced Considerations
While connecting data sources is often straightforward, some scenarios require additional configuration. Here are a few aspects to consider:
- Security: Always prioritize security by using strong credentials and access controls. Consider user permissions and network restrictions to safeguard your data.
- Query Language: Each data source has its query language for retrieving data. Familiarize yourself with the specific syntax to craft effective queries for your visualizations.
- Data Transformation: Sometimes, you might need to manipulate the raw data before visualization. Grafana offers built-in transformation capabilities or allows integration with external tools for advanced data wrangling.
Unlocking the Power of Visualization
Once you've successfully connected your data sources, the magic begins. You can leverage Grafana's powerful visualization tools to create stunning dashboards that transform raw data into actionable insights. Explore various chart types, leverage annotations and alerts, and build interactive dashboards to empower informed decision-making.
Conclusion
Connecting Grafana to your data sources is essential for unlocking its full potential as a data visualization and monitoring tool. By following the steps outlined in this article, you can easily connect Grafana to databases, APIs, and other data sources, enabling you to create insightful dashboards and gain valuable insights from your data.
Join the conversation! Your thoughts help the community grow.