

In this article I will discuss the fundamental concepts of Power BI. So this article will cover basic knowledge on power BI, the need of power BI, the importance of data visualizations, the components of Power BI, the architecture of Power BI, the building blocks of Power BI & the cost of power BI tools.
So let’s get started.
What is Power BI?
Nowadays, Business Intelligence has become the most trending technology. Huge amounts of raw data can be converted into meaningful & useful information which will help us to understand our business properly. Suppose in an organization we are having lots of data and suddenly we get a requirement from a client to provide a detailed analytical report for the company’s financial or sales or whatever it may be for a whole tenure of the last five years or more for which they want the data to be quickly converted into an analyzed report or a visualized report. So in that scenario, how we can do that? For this Microsoft has provided Power BI, a cloud based, business analytics service tool which can be used to analyze huge amounts of data into visualizations. Sometimes it’s very complex to convert or analyze a report from a bunch of datas. So this powerful tool helps us to understand, analyze and visualize our data in a convenient way.
Refer fig-1 for the overview of Power BI tool,
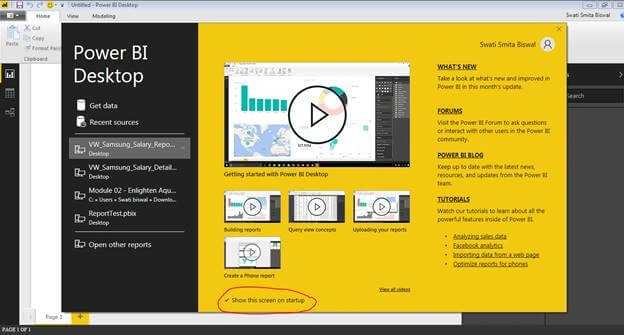
Fig-1 represents the opening page of the power BI tool. This page gives the monthly update on Power BI: what's new link, forums, Power BI blogs & tutorials, recent files & data source are listed on the left hand side. You can also hide this page by unchecking the option “Show on Startup” option.
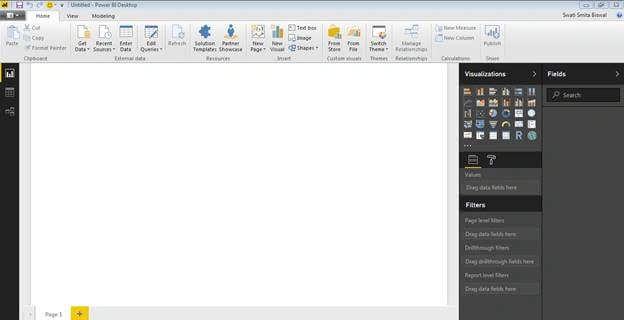
Fig-2 represents the page where you can design your custom reports.
Need of Power BI
We can get following benefits from Power BI tool described as below,
- It provides fast answers to any business query in forms of visual reports.
- Enables real-time analysis with quick navigations.
- Use of slicer will help to identify cross-selling & up-selling opportunities.
- Reduces the risk of bottle necks.
- Provides better understanding of your business.
- Helps in historical analysis.
- Provides a wide range of visualizations of data.
- Helps to create quick insights from an excel sheets or local database (Power BI provides lot of data sources like sql server, oracle etc. Refer fig-2).
- Helps to create custom visuals such as bar graph, pie chart, clustered column chart etc.
- Identify issues & Improves Performance, Decision making.
- No dependency on information technology staff or database administrators.
- Allows sharing of report to anyone or everyone you want.
- Identify relationships & data flow patterns.
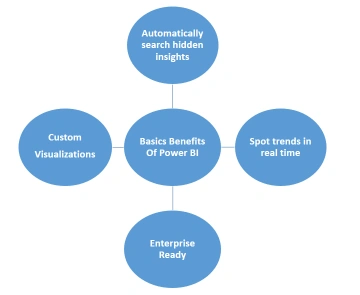
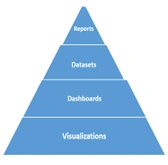
Fig-3 represents the basic 4 benefits of Using Power BI.
Importance of Data Visualizations in Power BI
A picture is worth a thousand words -- especially when you’re trying to find relationships and understand your data, which could include thousands or millions of variables. Data Visualizations make sense of data. So data visualization is a collection of data which can be represented in a pictorial, data story or graphical way. With interactive visualizations like charts or graphs we can change what data we see and how it’s processed.
So data visualization depicts the following importance in representing the data,
- Data visualizations provide the easiest way to see patterns emerge & change over time.
- It allows us to quickly interpret the data & adjust different variables to see their effect, and technology is increasingly making it easier for us to do so.
- It turns letters & numbers into pleasing visuals which helps us to recognize patterns & find exceptions.
- It helps in giving better customer insights.
- It helps to predict company’s past & future growth.
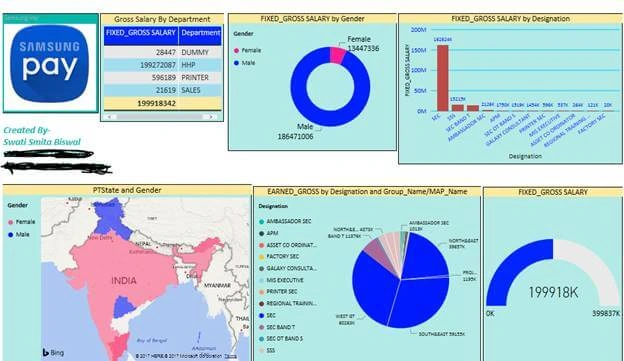
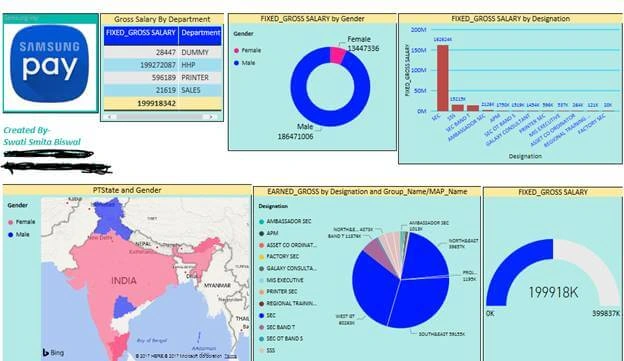
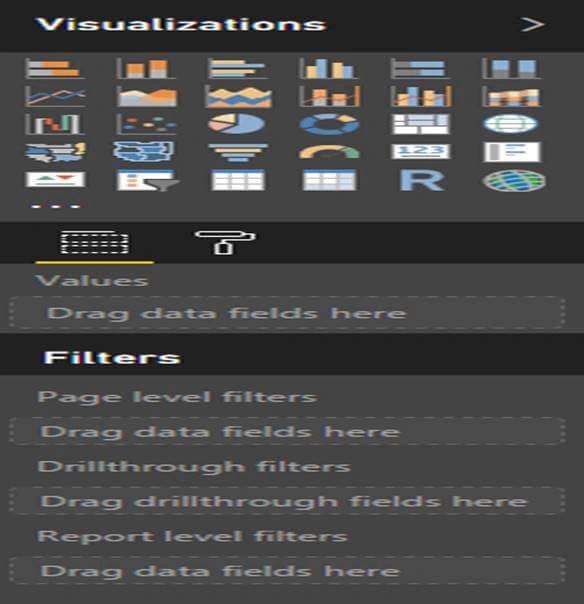
- Power BI provide Visualizations such as Map representation, Card Visualizations, stacked area chart, tree map, clustered column chart, pie chart etc.
- Apart from this power BI provides several custom visuals which can be imported from power BI store.
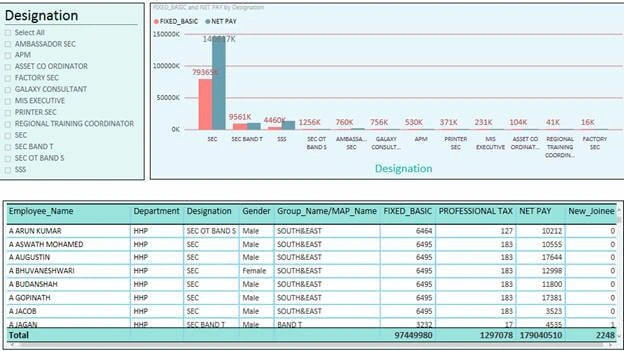
Refer to the below image for some of the Power BI visuals,

Rushi MehtaPosted Nov 29, 2019, 4:23 AM
Nice article to learn for the begineers
Madhanmohan DevarajanPosted Oct 19, 2017, 11:42 AM
Nice article for the beginners to start learning about Power BI.
Rajkiran SwainPosted Oct 18, 2017, 3:14 PM
Superb ...................