
Introduction
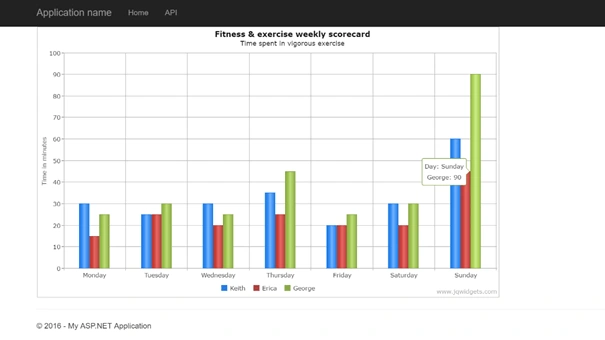
In this article, we will learn, how to use column series chart, using Web API2, AngularJS, and ADO.NET Framework.
Prerequisites
As I said before, we are going to use jqwidgets plugin in our MVC Application with AngularJS. For this, you must have Visual Studio 2015 (.NET Framework 4.5.2) and SQL Server.
SQL database part
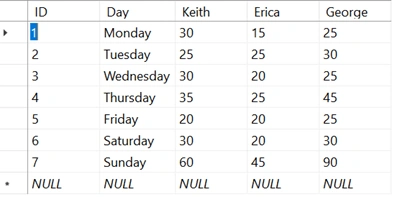
Here, you find the scripts to create the database and the table.
Create database
- USE [master]
- GO
- /****** Object: Database [DataSys] Script Date: 9/17/2016 8:15:45 AM ******/
- CREATE DATABASE [DataSys]
- CONTAINMENT = NONE
- ON PRIMARY
- ( NAME = N'DataSys', FILENAME = N'c:\Program Files (x86)\Microsoft SQL Server\MSSQL11.MSSQLSERVER\MSSQL\DATA\DataSys.mdf' , SIZE = 3072KB , MAXSIZE = UNLIMITED, FILEGROWTH = 1024KB )
- LOG ON
- ( NAME = N'DataSys_log', FILENAME = N'c:\Program Files (x86)\Microsoft SQL Server\MSSQL11.MSSQLSERVER\MSSQL\DATA\DataSys_log.ldf' , SIZE = 1024KB , MAXSIZE = 2048GB , FILEGROWTH = 10%)
- GO
- ALTER DATABASE [DataSys] SET COMPATIBILITY_LEVEL = 110
- GO
- IF (1 = FULLTEXTSERVICEPROPERTY('IsFullTextInstalled'))
- begin
- EXEC [DataSys].[dbo].[sp_fulltext_database] @action = 'enable'
- end
- GO
- ALTER DATABASE [DataSys] SET ANSI_NULL_DEFAULT OFF
- GO
- ALTER DATABASE [DataSys] SET ANSI_NULLS OFF
- GO
- ALTER DATABASE [DataSys] SET ANSI_PADDING OFF
- GO
- ALTER DATABASE [DataSys] SET ANSI_WARNINGS OFF
- GO
- ALTER DATABASE [DataSys] SET ARITHABORT OFF
- GO
- ALTER DATABASE [DataSys] SET AUTO_CLOSE OFF
- GO
- ALTER DATABASE [DataSys] SET AUTO_CREATE_STATISTICS ON
- GO
- ALTER DATABASE [DataSys] SET AUTO_SHRINK OFF
- GO
- ALTER DATABASE [DataSys] SET AUTO_UPDATE_STATISTICS ON
- GO
- ALTER DATABASE [DataSys] SET CURSOR_CLOSE_ON_COMMIT OFF
- GO
- ALTER DATABASE [DataSys] SET CURSOR_DEFAULT GLOBAL
- GO
- ALTER DATABASE [DataSys] SET CONCAT_NULL_YIELDS_NULL OFF
- GO
- ALTER DATABASE [DataSys] SET NUMERIC_ROUNDABORT OFF
- GO
- ALTER DATABASE [DataSys] SET QUOTED_IDENTIFIER OFF
- GO
- ALTER DATABASE [DataSys] SET RECURSIVE_TRIGGERS OFF
- GO
- ALTER DATABASE [DataSys] SET DISABLE_BROKER
- GO
- ALTER DATABASE [DataSys] SET AUTO_UPDATE_STATISTICS_ASYNC OFF
- GO
- ALTER DATABASE [DataSys] SET DATE_CORRELATION_OPTIMIZATION OFF
- GO
- ALTER DATABASE [DataSys] SET TRUSTWORTHY OFF
- GO
- ALTER DATABASE [DataSys] SET ALLOW_SNAPSHOT_ISOLATION OFF
- GO
- ALTER DATABASE [DataSys] SET PARAMETERIZATION SIMPLE
- GO
- ALTER DATABASE [DataSys] SET READ_COMMITTED_SNAPSHOT OFF
- GO
- ALTER DATABASE [DataSys] SET HONOR_BROKER_PRIORITY OFF
- GO
- ALTER DATABASE [DataSys] SET RECOVERY SIMPLE
- GO
- ALTER DATABASE [DataSys] SET MULTI_USER
- GO
- ALTER DATABASE [DataSys] SET PAGE_VERIFY CHECKSUM
- GO
- ALTER DATABASE [DataSys] SET DB_CHAINING OFF
- GO
- ALTER DATABASE [DataSys] SET FILESTREAM( NON_TRANSACTED_ACCESS = OFF )
- GO
- ALTER DATABASE [DataSys] SET TARGET_RECOVERY_TIME = 0 SECONDS
- GO
- ALTER DATABASE [DataSys] SET READ_WRITE
- GO
- USE [DataSys]
- GO
- /****** Object: Table [dbo].[ChartKEG] Script Date: 9/17/2016 8:16:06 AM ******/
- SET ANSI_NULLS ON
- GO
- SET QUOTED_IDENTIFIER ON
- GO
- SET ANSI_PADDING ON
- GO
- CREATE TABLE [dbo].[ChartKEG](
- [ID] [int] NOT NULL,
- [Day] [varchar](50) NULL,
- [Keith] [int] NULL,
- [Erica] [int] NULL,
- [George] [int] NULL,
- CONSTRAINT [PK_ChartKEG] PRIMARY KEY CLUSTERED
- (
- [ID] ASC
- )WITH (PAD_INDEX = OFF, STATISTICS_NORECOMPUTE = OFF, IGNORE_DUP_KEY = OFF, ALLOW_ROW_LOCKS = ON, ALLOW_PAGE_LOCKS = ON) ON [PRIMARY]
- ) ON [PRIMARY]
- GO
- SET ANSI_PADDING OFF
- GO
Create your MVC application
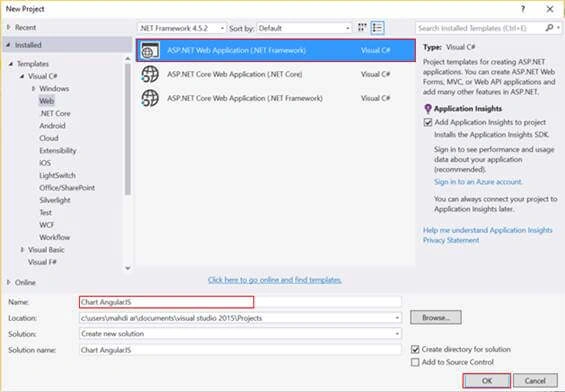
Open Visual Studio and select file, click new project, a new dialog will pop up with the name New Project. Select ASP.NET Web Application (.NET Framework), name your project and click OK button.
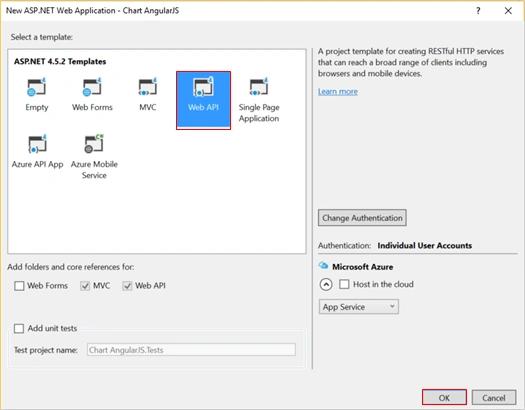
Now, new dialog will pop up to select the template. We are going to choose Web API and click OK.
After creating our project, we will proceed to create Web API2 controller.
Create a controller
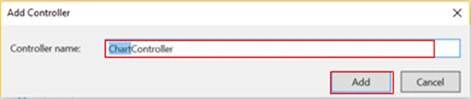
Now, we are going to create a controller. Right click on the controllers folder > Add > Controller> select Web API 2 Controller – Empty > click Add.
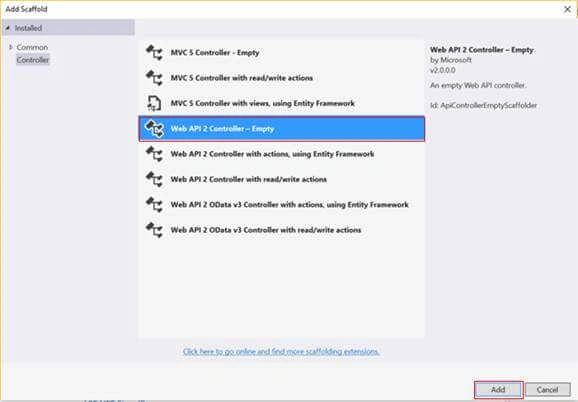
Enter Controller name (‘ChartController’).
ChartController.cs
- using System;
- using System.Collections.Generic;
- using System.Data.SqlClient;
- using System.Linq;
- using System.Net;
- using System.Net.Http;
- using System.Web.Http;
- using Chart_AngularJS.Models;
- namespace Chart_AngularJS.Controllers
- {
- public class ChartController : ApiController
- {
- [HttpGet]
- public List<ChartModel> GetDataList()
- {
- SqlConnection conx = new SqlConnection("Data Source=.;Initial Catalog=DataSys;Integrated Security=True");
- conx.Open();
- SqlCommand cmd = new SqlCommand("SELECT * FROM ChartKEG", conx);
- List<ChartModel> listData = new List<Models.ChartModel>();
- SqlDataReader dr = cmd.ExecuteReader();
- while (dr.Read())
- {
- ChartModel chart = new Models.ChartModel();
- chart.Day = dr[1].ToString();
- chart.Keith = int.Parse(dr[2].ToString());
- chart.Erica = int.Parse(dr[3].ToString());
- chart.George = int.Parse(dr[4].ToString());
- listData.Add(chart);
- }
- conx.Close();
- return listData;
- }
- }
- }
For this action, I’m using ADO.NET framework instead of Entity Framework. First of all, we need to declare SqlConnection object, which allows us to connect to the database (in our case Datasys). We should use SqlCommand object, which takes two parameters respectively , which are query string and connection object. We need to declare SqlDataReader, which receives the records after executing ExecuteReader() method. Finally, we use while to loop all the records.
Here, you find the definition of ChartModel class.
ChartModel.cs
- using System;
- using System.Collections.Generic;
- using System.Linq;
- using System.Web;
- namespace Chart_AngularJS.Models
- {
- public class ChartModel
- {
- public string Day { get; set; }
- public int Keith { get; set; }
- public int Erica { get; set; }
- public int George { get; set; }
- }
- }
- using Chart_AngularJS.Models;
- using System;
- using System.Collections.Generic;
- using System.Linq;
- using System.Net.Http;
- using System.Web;
- using System.Web.Mvc;
- namespace Chart_AngularJS.Controllers
- {
- public class HomeController : Controller
- {
- public ActionResult Index()
- {
- ViewBag.Title = "Home Page";
- return View();
- }
- IEnumerable<ChartModel> PopulationList = Enumerable.Empty<ChartModel>();
- [HttpGet]
- public JsonResult GetChartList()
- {
- HttpClient client = new HttpClient();
- client.BaseAddress = new Uri("http://localhost:49487/");
- client.DefaultRequestHeaders.Accept.Add(new System.Net.Http.Headers.MediaTypeWithQualityHeaderValue("application/json"));
- HttpResponseMessage response = client.GetAsync("api/Chart").Result;
- if (response.IsSuccessStatusCode)
- {
- PopulationList = response.Content.ReadAsAsync<List<ChartModel>>().Result;
- }
- return Json(PopulationList, JsonRequestBehavior.AllowGet);
- }
- }
- }
To call our API, you need to-
- Create an object from HttpClient class.
- Specify URL of our API (in this example, the URL used is: http://localhost:49487/ ).
- The header of request. I’m choosing application/json, but you can choose another format like XML, CSV etc.
- Finally, to call API, we need to use GetAsyc("api/Chart"), as mentioned above.
Adding View
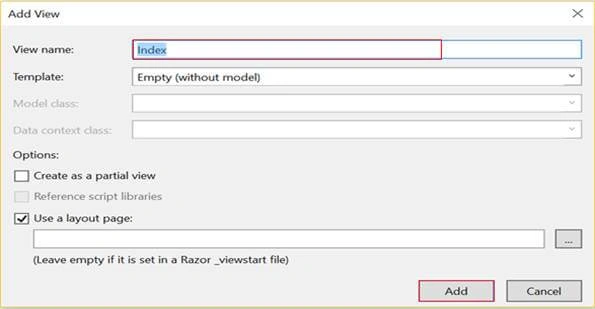
In Home controller, just right click on Index() action, select Add view and dialog will pop up.Write a name for your view and finally click Add.
Note - Don’t forget to download the libraries, given below, from jqxwidgets-
- <!-- CSS -->
- <link href="~/Content/jqx.base.css" rel="stylesheet" />
- <!-- JS -->
- <script src="https://ajax.googleapis.com/ajax/libs/angularjs/1.4.7/angular.min.js"></script>
- <script src="~/Scripts/jqxangular.js"></script>
- <script src="~/Scripts/jqxcore.js"></script>
- <script src="~/Scripts/jqxdata.js"></script>
- <script src="~/Scripts/jqxdraw.js"></script>
- <script src="~/Scripts/jqxchart.core.js"></script>
- @{
- ViewBag.Title = "Home Page";
- }
- @section scripts{
- <!-- CSS -->
- <link href="~/Content/jqx.base.css" rel="stylesheet" />
- <!-- JS -->
- <script src="https://ajax.googleapis.com/ajax/libs/angularjs/1.4.7/angular.min.js"></script>
- <script src="~/Scripts/jqxangular.js"></script>
- <script src="~/Scripts/jqxcore.js"></script>
- <script src="~/Scripts/jqxdata.js"></script>
- <script src="~/Scripts/jqxdraw.js"></script>
- <script src="~/Scripts/jqxchart.core.js"></script>
- <script type="text/javascript">
- var demoApp = angular.module("myApp", ["jqwidgets"]);
- demoApp.controller("ChartCtrl", ['$scope', function ($scope) {
- //prepare chart data as an array
- var source = {
- datatype: 'json',
- datafields: [
- { name: 'Day' },
- { name: 'Keith' },
- { name: 'Erica' },
- { name: 'George' }
- ],
- url: 'GetChartList',
- };
- var dataAdapter = new $.jqx.dataAdapter(source);
- // prepare jqxChart settings
- var settings = {
- title: "Fitness & exercise weekly scorecard",
- description: "Time spent in vigorous exercise",
- enableAnimations: true,
- showLegend: true,
- padding: { left: 5, top: 5, right: 5, bottom: 5 },
- titlePadding: { left: 90, top: 0, right: 0, bottom: 10 },
- source: dataAdapter,
- xAxis:
- {
- dataField: 'Day',
- showGridLines: true
- },
- colorScheme: 'scheme01',
- seriesGroups:
- [
- {
- type: 'column',
- columnsGapPercent: 50,
- seriesGapPercent: 0,
- valueAxis:
- {
- unitInterval: 10,
- minValue: 0,
- maxValue: 100,
- displayValueAxis: true,
- description: 'Time in minutes',
- axisSize: 'auto',
- tickMarksColor: '#888888'
- },
- series: [
- { dataField: 'Keith', displayText: 'Keith' },
- { dataField: 'Erica', displayText: 'Erica' },
- { dataField: 'George', displayText: 'George' }
- ]
- }
- ]
- };
- $scope.chartSettings = settings;
- }]);
- </script>
- }
- <div ng-app="myApp" ng-controller="ChartCtrl">
- <jqx-chart id='chartContainer' jqx-settings="chartSettings" style="width: 850px; height: 500px"></jqx-chart>
- </div>
Join the conversation! Your thoughts help the community grow.